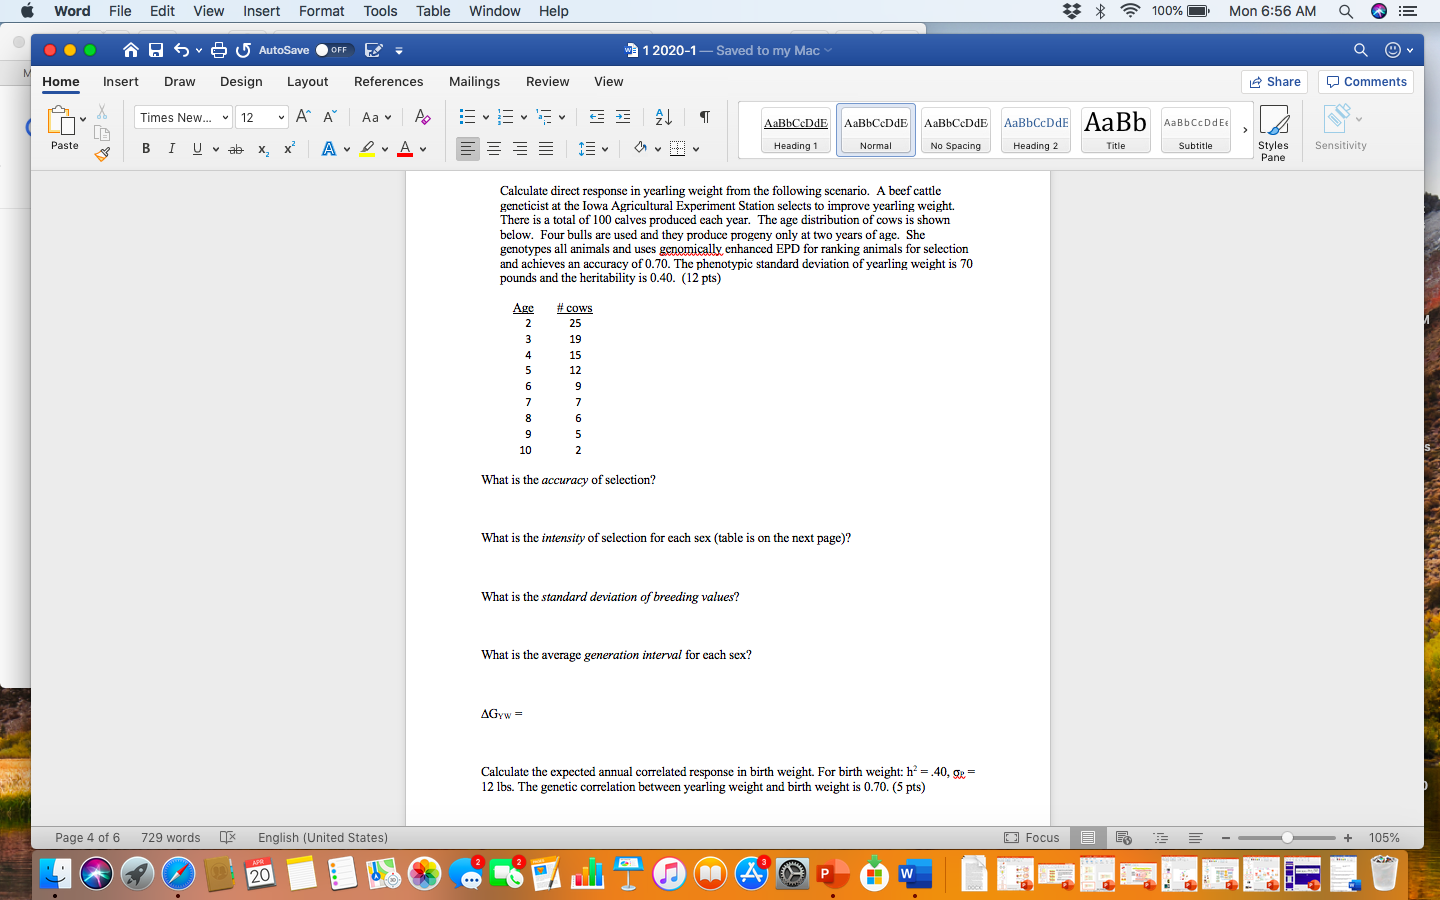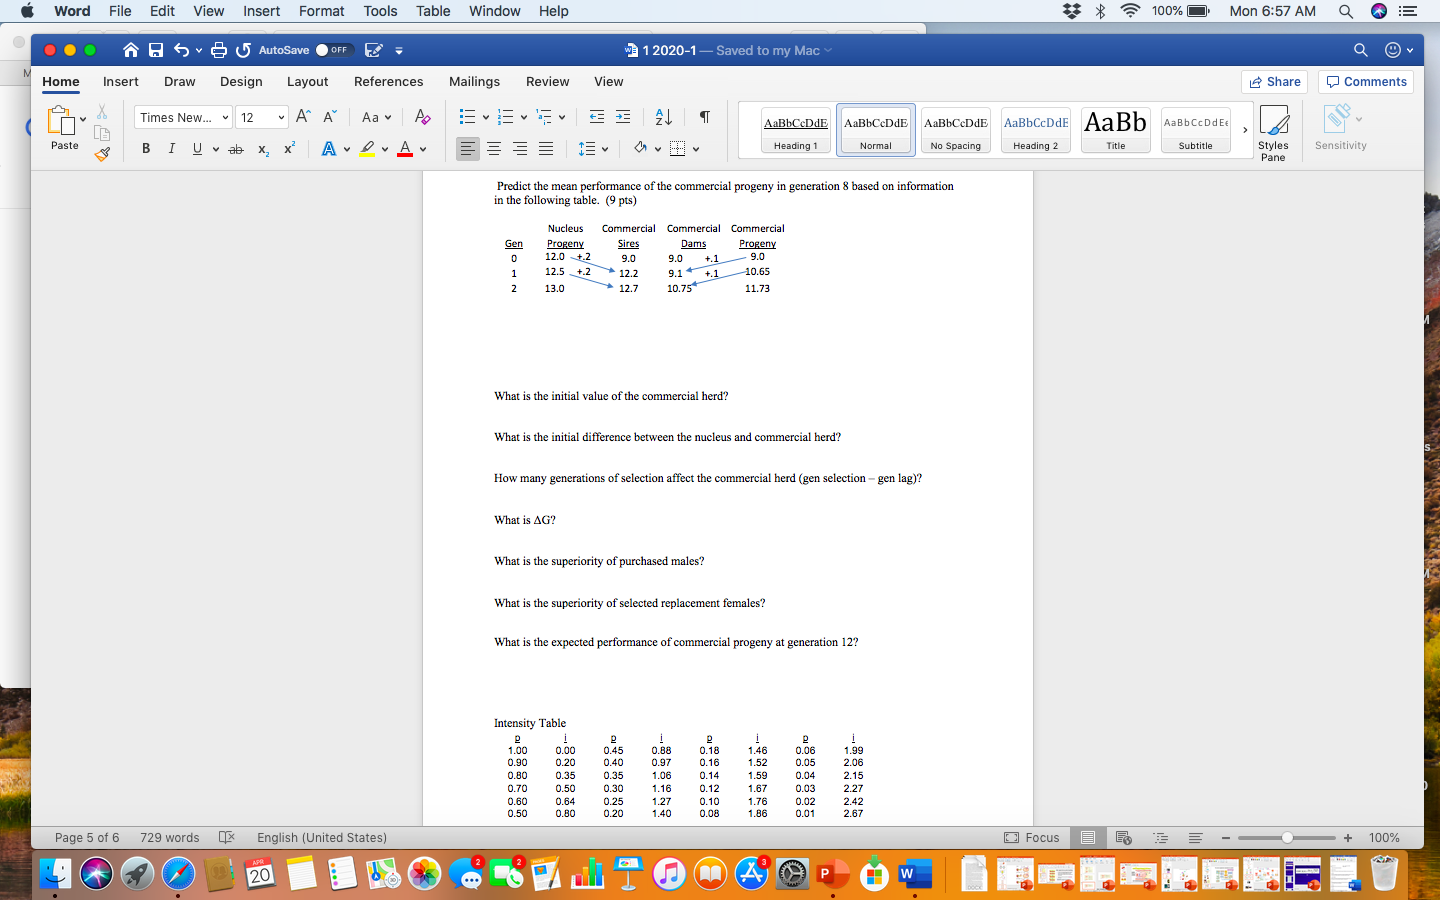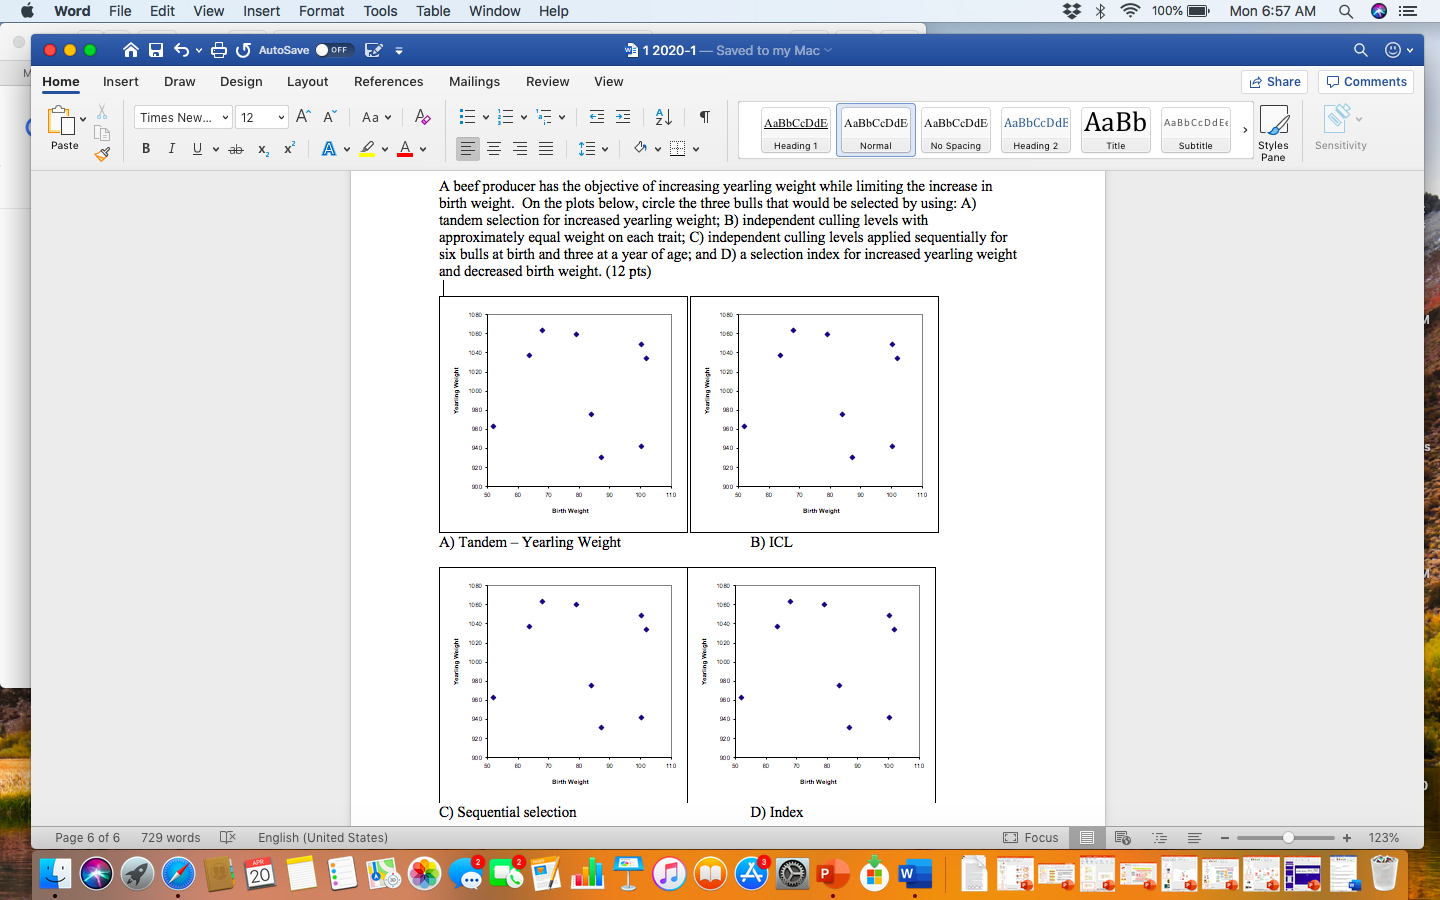


Word File Edit View Insert Format Tools Table Window Help * 100% O Mon 6:56 AM a 5 0. A AutoSave OFFE W 12020-1 - Saved to my Mac Home Insert Draw Design Layout References Mailings Review View Share Comments to v All AaBbCcDdE AaBb CcDdE Times New... 12 A Aav Paste BI U 8 x, x? ADA v E AaBbCcDdE Normal AaBbCcDdE AaBbCcDdE AaBb No Spacing Heading 2 E Heading 1 Subtitle Styles Pane Sensitivity Calculate direct response in yearling weight from the following scenario. A beef cattle geneticist at the Iowa Agricultural Experiment Station selects to improve yearling weight. There is a total of 100 calves produced each year. The age distribution of cows is shown below. Four bulls are used and they produce progeny only at two years of age. She genotypes all animals and uses genomically enhanced EPD for ranking animals for selection and achieves an accuracy of 0.70. The phenotypic standard deviation of yearling weight is 70 pounds and the heritability is 0.40. (12 pts) Age #cows 25 5.00 von w What is the accuracy of selection? What is the intensity of selection for each sex (table is on the next page)? What is the standard deviation of breeding values? What is the average generation interval for each sex? AGYw= Calculate the expected annual correlated response in birth weight. For birth weight: h= .40,- 12 lbs. The genetic correlation between yearling weight and birth weight is 0.70. (5 pts) Page 4 of 6 729 words X English (United States) Focus E S 3 - + 105% Word File Edit View Insert Format Tools Table Window Help * 100% O Mon 6:57 AM a 5 0. A AutoSave OFFE W 12020-1 - Saved to my Mac Home Insert Draw Design Layout References Mailings Review View Share Comments E AaBbCcDdE AaBbCcDdE AaBb CcDdEt Times New... 12A A Aa Paste BI U 8 x, x? ADA Ao Evv E AaBbCcDdE AaBbCcDdE AaBb No Spacing Heading 2 E Heading 1 Normal Subtitle Styles Pane Sensitivity Predict the mean performance of the commercial progeny in generation 8 based on information in the following table. (9 pts) Gen 0 1 2 Nucleus Progeny 12.0 +.2 12.5 +. 2 13.0 Commercial Commercial Commercial Sires Dams Progeny 9.0 9.0 +. 1 9 .0 1 2.2 9.1 + +.1 10.65 12.7 10.75 11.73 What is the initial value of the commercial herd? What is the initial difference between the nucleus and commercial herd? How many generations of selection affect the commercial herd (gen selection - gen lag)? What is AG? What is the superiority of purchased males? What is the superiority of selected replacement females? What is the expected performance of commercial progeny at generation 12? Intensity Table 1.000.00 0.90 0.20 0.80 0.35 0.70 0.50 0.600.64 0.50 0.30 D 0.45 0.40 0.35 0.30 0.25 0.20 0.88 0.97 1.06 1.16 1.27 1.40 0.18 0.16 0.14 0.12 0.10 0.08 1.46 1.52 1.59 1.67 1.76 1.86 p 0.06 0.05 0.04 0.03 0.02 1.99 2.06 2.15 2.27 2.42 Page 5 of 6 729 words English (United States) Focus E S 3 - + 100% Word File Edit View Insert Format Tools Table Window Help * 100% O Mon 6:57 AM a 5 0. A AutoSave OFFE W 12020-1 - Saved to my Mac Home Insert Draw Design Layout References Mailings Review View Share Comments Al AaBbCcDdE AaBb CcDdE Times New... 12A A Aa Paste BI U 8 x, x? ADA Ao Evev E AaBbCcDdE Normal AaBbCcDdE AaBbCcDdE AaBb No Spacing Heading 2 Title E Heading 1 Subtitle Styles Pane Sensitivity A beef producer has the objective of increasing yearling weight while limiting the increase in birth weight. On the plots below, circle the three bulls that would be selected by using: A) tandem selection for increased yearling weight; B) independent culling levels with approximately equal weight on each trait; C) independent culling levels applied sequentially for six bulls at birth and three at a year of age; and D) a selection index for increased yearling weight and decreased birth weight. (12 pts) Yearling Weight 1201 50 50 100 110 Birth Weight Birth Weight A) Tandem - Yearling Weight B) ICL Yearling Weight 500 1000 100110 Bith Weight Birth Weight C) Sequential selection D) Index Page 6 of 6 729 words English (United States) Focus E . ' - + 123% Word File Edit View Insert Format Tools Table Window Help * 100% O Mon 6:56 AM a 5 0. A AutoSave OFFE W 12020-1 - Saved to my Mac Home Insert Draw Design Layout References Mailings Review View Share Comments to v All AaBbCcDdE AaBb CcDdE Times New... 12 A Aav Paste BI U 8 x, x? ADA v E AaBbCcDdE Normal AaBbCcDdE AaBbCcDdE AaBb No Spacing Heading 2 E Heading 1 Subtitle Styles Pane Sensitivity Calculate direct response in yearling weight from the following scenario. A beef cattle geneticist at the Iowa Agricultural Experiment Station selects to improve yearling weight. There is a total of 100 calves produced each year. The age distribution of cows is shown below. Four bulls are used and they produce progeny only at two years of age. She genotypes all animals and uses genomically enhanced EPD for ranking animals for selection and achieves an accuracy of 0.70. The phenotypic standard deviation of yearling weight is 70 pounds and the heritability is 0.40. (12 pts) Age #cows 25 5.00 von w What is the accuracy of selection? What is the intensity of selection for each sex (table is on the next page)? What is the standard deviation of breeding values? What is the average generation interval for each sex? AGYw= Calculate the expected annual correlated response in birth weight. For birth weight: h= .40,- 12 lbs. The genetic correlation between yearling weight and birth weight is 0.70. (5 pts) Page 4 of 6 729 words X English (United States) Focus E S 3 - + 105% Word File Edit View Insert Format Tools Table Window Help * 100% O Mon 6:57 AM a 5 0. A AutoSave OFFE W 12020-1 - Saved to my Mac Home Insert Draw Design Layout References Mailings Review View Share Comments E AaBbCcDdE AaBbCcDdE AaBb CcDdEt Times New... 12A A Aa Paste BI U 8 x, x? ADA Ao Evv E AaBbCcDdE AaBbCcDdE AaBb No Spacing Heading 2 E Heading 1 Normal Subtitle Styles Pane Sensitivity Predict the mean performance of the commercial progeny in generation 8 based on information in the following table. (9 pts) Gen 0 1 2 Nucleus Progeny 12.0 +.2 12.5 +. 2 13.0 Commercial Commercial Commercial Sires Dams Progeny 9.0 9.0 +. 1 9 .0 1 2.2 9.1 + +.1 10.65 12.7 10.75 11.73 What is the initial value of the commercial herd? What is the initial difference between the nucleus and commercial herd? How many generations of selection affect the commercial herd (gen selection - gen lag)? What is AG? What is the superiority of purchased males? What is the superiority of selected replacement females? What is the expected performance of commercial progeny at generation 12? Intensity Table 1.000.00 0.90 0.20 0.80 0.35 0.70 0.50 0.600.64 0.50 0.30 D 0.45 0.40 0.35 0.30 0.25 0.20 0.88 0.97 1.06 1.16 1.27 1.40 0.18 0.16 0.14 0.12 0.10 0.08 1.46 1.52 1.59 1.67 1.76 1.86 p 0.06 0.05 0.04 0.03 0.02 1.99 2.06 2.15 2.27 2.42 Page 5 of 6 729 words English (United States) Focus E S 3 - + 100% Word File Edit View Insert Format Tools Table Window Help * 100% O Mon 6:57 AM a 5 0. A AutoSave OFFE W 12020-1 - Saved to my Mac Home Insert Draw Design Layout References Mailings Review View Share Comments Al AaBbCcDdE AaBb CcDdE Times New... 12A A Aa Paste BI U 8 x, x? ADA Ao Evev E AaBbCcDdE Normal AaBbCcDdE AaBbCcDdE AaBb No Spacing Heading 2 Title E Heading 1 Subtitle Styles Pane Sensitivity A beef producer has the objective of increasing yearling weight while limiting the increase in birth weight. On the plots below, circle the three bulls that would be selected by using: A) tandem selection for increased yearling weight; B) independent culling levels with approximately equal weight on each trait; C) independent culling levels applied sequentially for six bulls at birth and three at a year of age; and D) a selection index for increased yearling weight and decreased birth weight. (12 pts) Yearling Weight 1201 50 50 100 110 Birth Weight Birth Weight A) Tandem - Yearling Weight B) ICL Yearling Weight 500 1000 100110 Bith Weight Birth Weight C) Sequential selection D) Index Page 6 of 6 729 words English (United States) Focus E . ' - + 123%


