

Answered step by step
Verified Expert Solution
Question
1 Approved Answer
Working matlab code and explanation. Thanks Consider the signal x(t): x(t) = e^-|t| Ideal sampling is applied to this signal. The sampling frequency is 2.6
 Working matlab code and explanation. Thanks
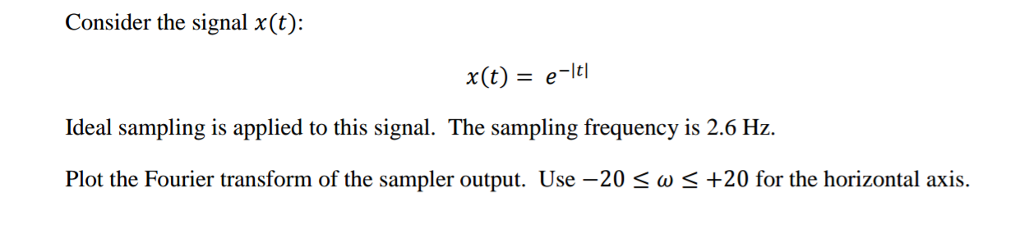
Consider the signal x(t): x(t) = e^-|t| Ideal sampling is applied to this signal. The sampling frequency is 2.6 Hz. Plot the Fourier transform of the sampler output. Use -20 lessthanorequalto omega lessthanorequalto + 20 for the horizontal axis
Step by Step Solution
There are 3 Steps involved in it
Step: 1

Get Instant Access to Expert-Tailored Solutions
See step-by-step solutions with expert insights and AI powered tools for academic success
Step: 2

Step: 3
Ace Your Homework with AI
Get the answers you need in no time with our AI-driven, step-by-step assistance
Get Started
Database Directions From Relational To Distributed Multimedia And Object Oriented Database Systems
Authors: James Larson
1st Edition
0132908670, 978-0132908672