Answered step by step
Verified Expert Solution
Link Copied!

Question

1 Approved Answer

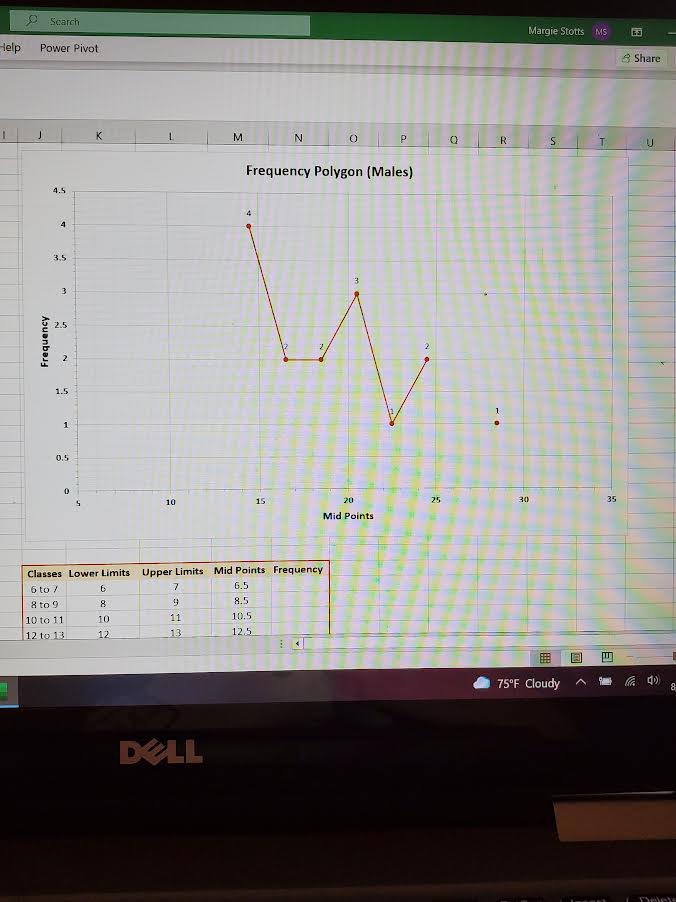
Would someone please provide me help with analyzing my data for my project, Optimism Research Data? Because of Covid, I am working extra and have

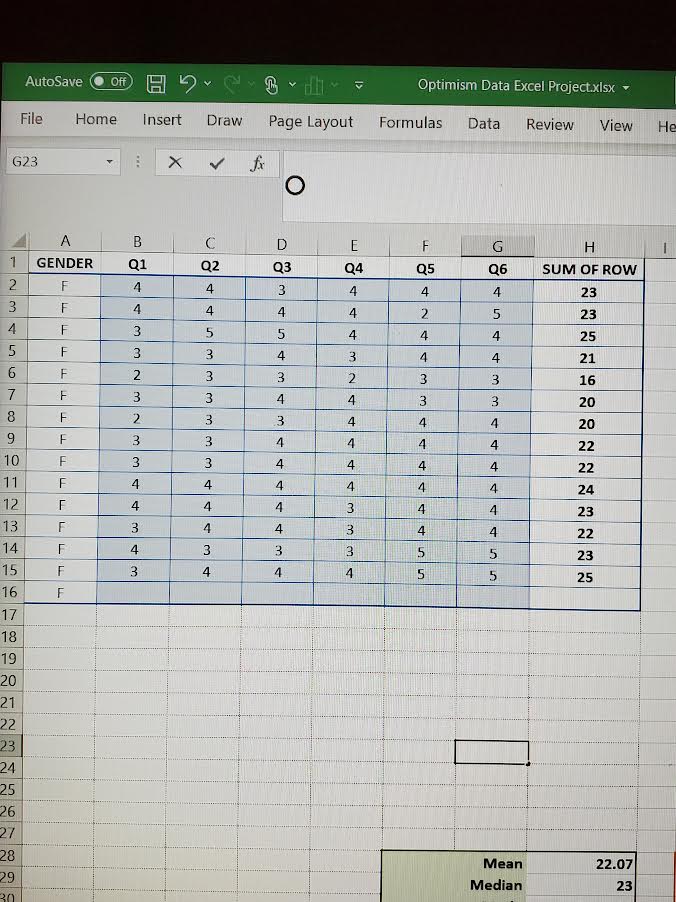
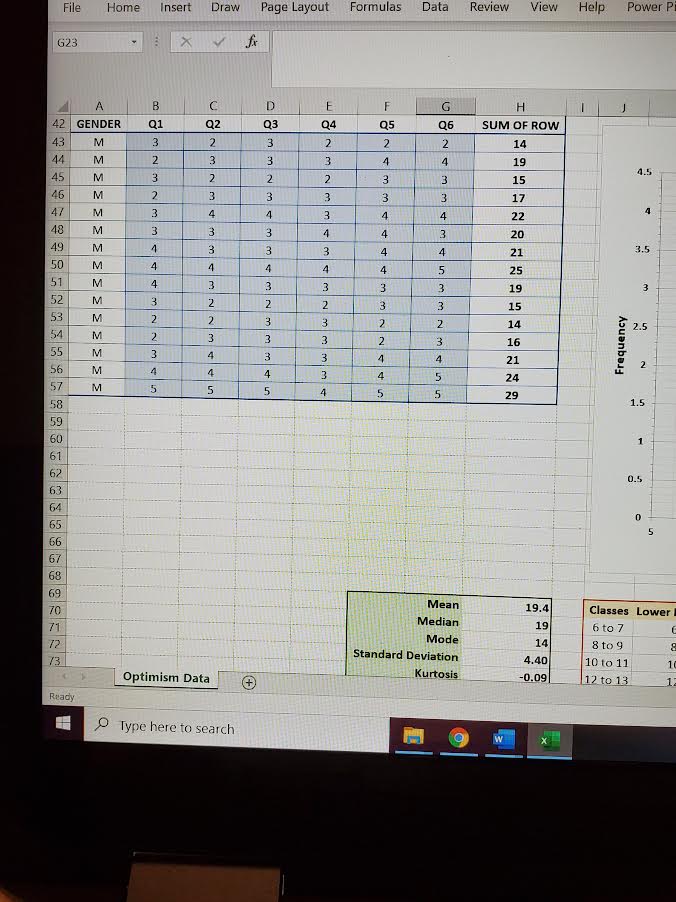
Would someone please provide me help with analyzing my data for my project, Optimism Research Data? Because of Covid, I am working extra and have gotten behind and this is due. I have entered the data in the preprogrammed excel sheet. I will attach pics of the spreadsheet as this will not let me attach the spreadsheet.

I have to write a paper to go with this explaining everything except the information contained here. Here are the instructions for analysis:

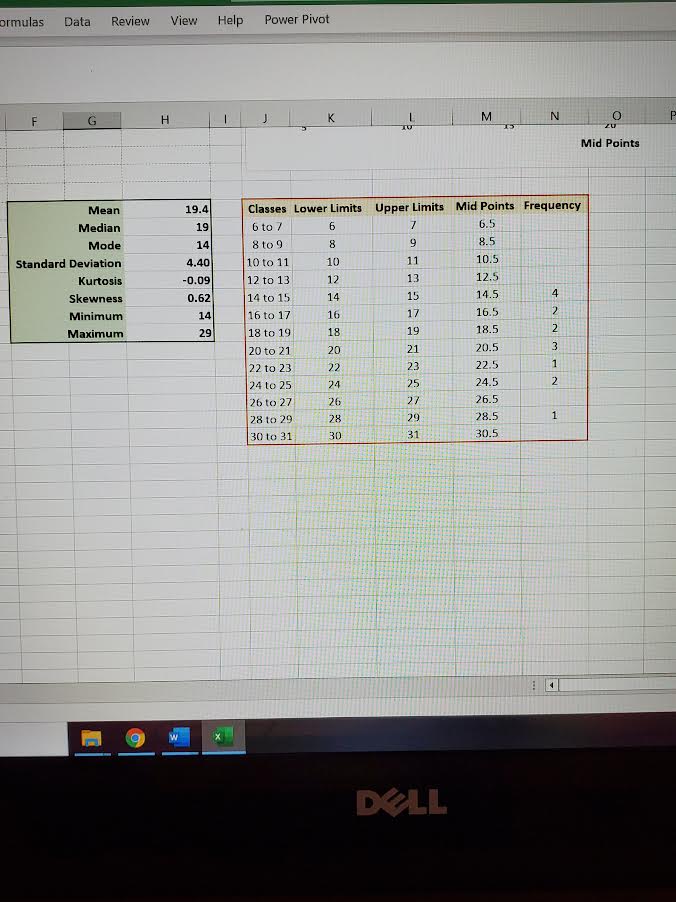
iv. Look at the mean, median, mode, and standard deviation and describe how these measures of central tendency indicate whether the distribution of men and women are normal or skewed. That is, is the distribution of men and women normal or skewed? How do the mean, median, and mode scores indicate if the distribution is normal or skewed?

v. Look at the table of raw data for both men and women. Explain why the raw numbers indicate the distribution is normal or skewed. If the distributions are normal how would the scores have to change to yield a skewed distribution? If the distributions are skewed, how would the scores have to change to yield a normal distribution?

P-Value and Optimism Study:

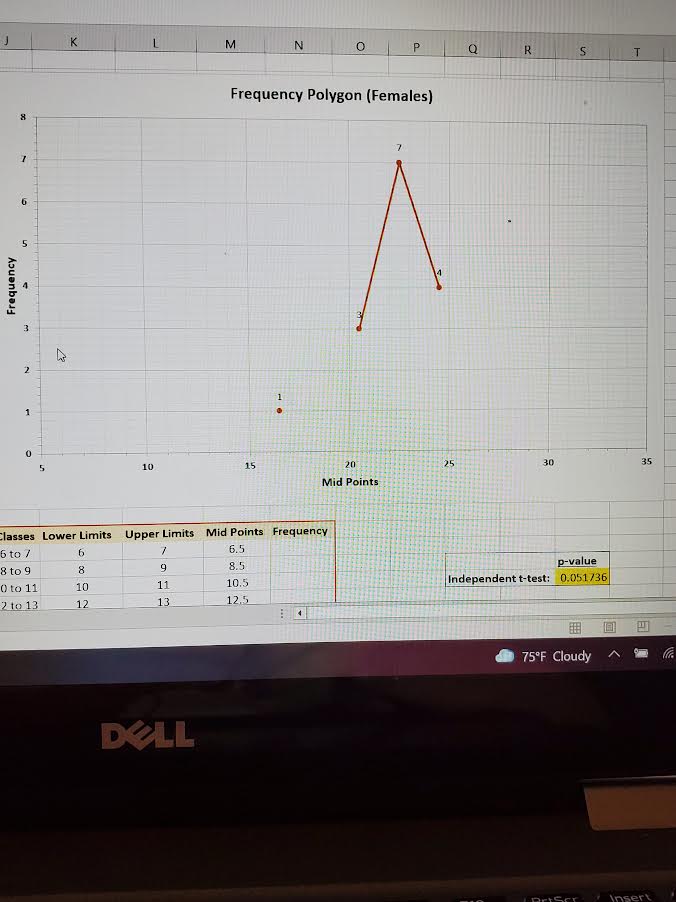
a. After all your data is in you will see your p-value for your independent t-test populate. Remember this independent t-test is used to analyze if the difference between two groups is statistically significant. This test is based on the 15 females and 15 males. This is a two-tail test and notes that we are assuming normality. In the analysis, I should state the null and alternative hypothesis and the decision based on the p-value that was provided in the cell. We are testing this level at a significance of 0.05.

Thank you in advance for whatever help you may give!

p-value Independent t-test: 0.051736
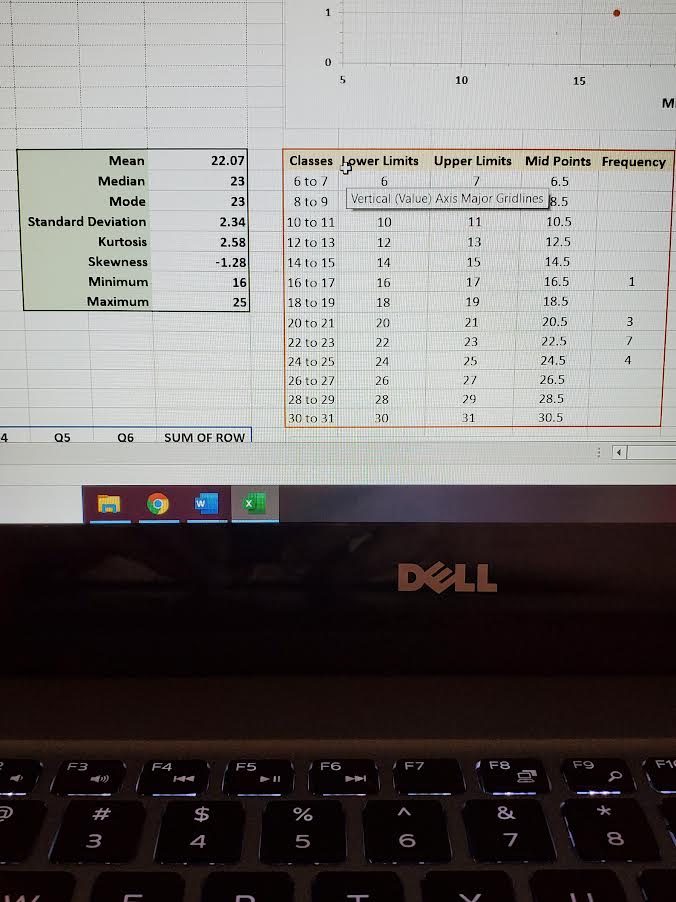
image text in transcribedimage text in transcribedimage text in transcribedimage text in transcribedimage text in transcribedimage text in transcribed
10 15 M Mean 22.07 Classes lower Limits Upper Limits Mid Points Frequency Median 23 6 to ? 6 6.5 Mode 23 8 to 9 Vertical (Value) Axis Major Gridlines g.5 Standard Deviation 2.34 10 to 11 10 11 10.5 Kurtosis 2.58 12 to 13 12 13 12.5 Skewness -1.28 14 to 15 14 15 14.5 Minimum 16 16 to 17 16 1/ 16.5 Maximum 25 18 to 19 18 19 18.5 20 to 21 20 21 20.5 22 to 23 22 23 22.5 24 to 25 24 25 24.5 26 to 27 26 27 26.5 28 to 29 28 29 28.5 30 to 31 30 31 30.5 4 Q5 Q6 SUM OF ROW W X DELL F3 F4 J F6 F7 FB F9 9% 3 4 5AutoSave OOD) H - - Optimism Data Excel Project.xisx . Insert Draw Page Layout Formulas Data Review View He File Home G23 X v fi O H A B C D E Ti G Q5 Q6 SUM OF ROW GENDER Q1 Q2 Q3 Q4 4 23 4 4 F 4 4 5 23 N 4 4 4 5 4 25 5 3 3 4 21 3 W 16 IN J W NOW 20 20 TI 22 J W N 4 22 10 4 24 11 F 23 12 22 13 W 5 23 14 25 3 4 4 15 16 17 18 19 20 22 24 25 26 27 Mean 22.07 28 Median 23 29J K M N O P Q R 5 T Frequency Polygon (Females) Frequency 10 15 20 25 30 3.5 Mid Points lasses Lower Limits Upper Limits Mid Points Frequency 6 to 7 6.5 8 to 9 8 9 8.5 p-value O to 11 10 11 10.5 Independent t-test: 0.051/36 2 to 13 12 13 12.5 75'F Cloudy A DELLormulas Data Review View Help Power Pivot F G H K M N O Mid Points Mean 19.4 Classes Lower Limits Upper Limits Mid Points Frequency Median 19 6 to 7 b 6.5 Mode 14 8 to 9 8 9 8.5 Standard Deviation 4.40 10 to 11 10 11 10.5 Kurtosis 0.09 12 to 13 12 13 12.5 Skewness 0.62 14 to 15 14 15 14.5 Minimum 14 16 to 17 16 17 16.5 Maximum 29 18 to 19 18 19 18.5 NOWNND 20 to 21 20 21 20.5 22 to 23 22 23 22.5 24 to 25 24 25 24.5 26 to 27 26 27 26.5 28 to 29 28 29 28.5 1 30 to 31 30 31 30.5 w x DELLDraw Page Layout Formulas Data Review View Help Power P File Home Insert G23 X V fr H B C D E F G Q4 Q5 SUM OF ROW 42 Q1 Q2 Q3 Q6 GENDER 2 2 2 14 43 M 3 3 4 19 4.5 44 M 2 3 AWWAN 15 45 M 3 2 17 46 M 2 3 22 47 M 3 4 3 20 48 M 3.5 21 49 M 25 50 M 19 51 M 15 52 M MU DS WN WW LI A 2. D W W W W N W D W 53 M 16 Frequency 54 M 55 M 24 56 M 57 29 M 1.5 58 1 60 61 0.5 62 63 64 65 66 67 68 69 Mean 19.4 Classes Lower 70 Median 19 6 to 7 71 Mode 14 8 to 9 72 Standard Deviation 4.40 10 to 11 13 Kurtosis -0.09 17 to 13 Optimism Data Ready Type here to search W XSearch Margie Stotts MS Help Power Pivot & Share K M N P R S U Frequency Polygon (Males) 4.5 2.5 Frequency 10 15 25 30 35 Mid Points Classes Lower Limits Upper Limits Mid Points Frequency 6 to ? 6.3 8 to 9 9 8.5 10 to 11 11 10.5 12 13 125 12 to 13 75'F Cloudy DELL

Step by Step Solution

There are 3 Steps involved in it

Step: 1

blur-text-image

Get Instant Access to Expert-Tailored Solutions

See step-by-step solutions with expert insights and AI powered tools for academic success

Step: 2

blur-text-image_2

Step: 3

blur-text-image_3

Ace Your Homework with AI

Get the answers you need in no time with our AI-driven, step-by-step assistance

Get Started

Recommended Textbook for

Finite Math And Applied Calculus

Authors: Stefan Waner, Steven Costenoble

6th Edition

1285415132, 9781285415130

More Books

Students also viewed these Mathematics questions

Question

Which expression represents the quotient of this model

Answered: 1 week ago