

Question: From the figures below we see that a single regression line (left) and different regression lines (right) have been fitted to the data. Here
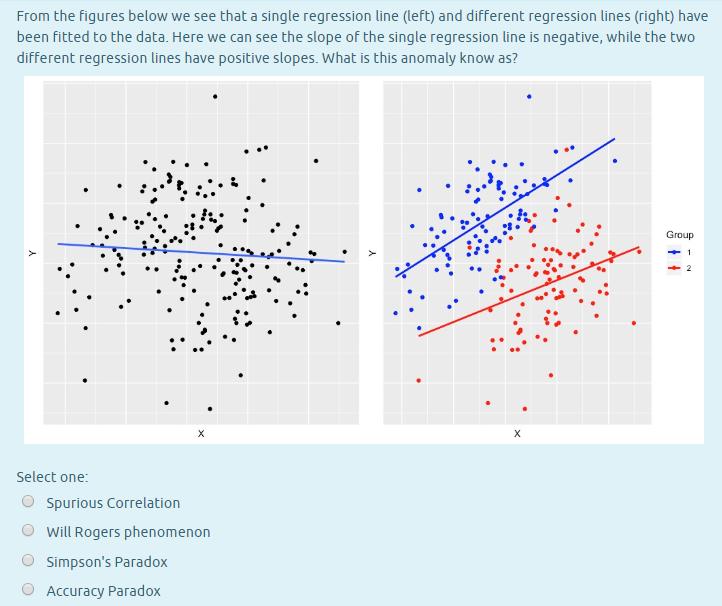
From the figures below we see that a single regression line (left) and different regression lines (right) have been fitted to the data. Here we can see the slope of the single regression line is negative, while the two different regression lines have positive slopes. What is this anomaly know as? Select one: X Spurious Correlation Will Rogers phenomenon Simpson's Paradox Accuracy Paradox X Group - 1 2
Step by Step Solution
★★★★★
3.56 Rating (156 Votes )
There are 3 Steps involved in it
1 Expert Approved Answer
Step: 1 Unlock

Answer Simpsons paradox Simpsons parad... View full answer
Question Has Been Solved by an Expert!
Get step-by-step solutions from verified subject matter experts
Step: 2 Unlock
Step: 3 Unlock