"Would you advise a friend to invest in this company?" (Hilton is the company)!
Complete the following Problem
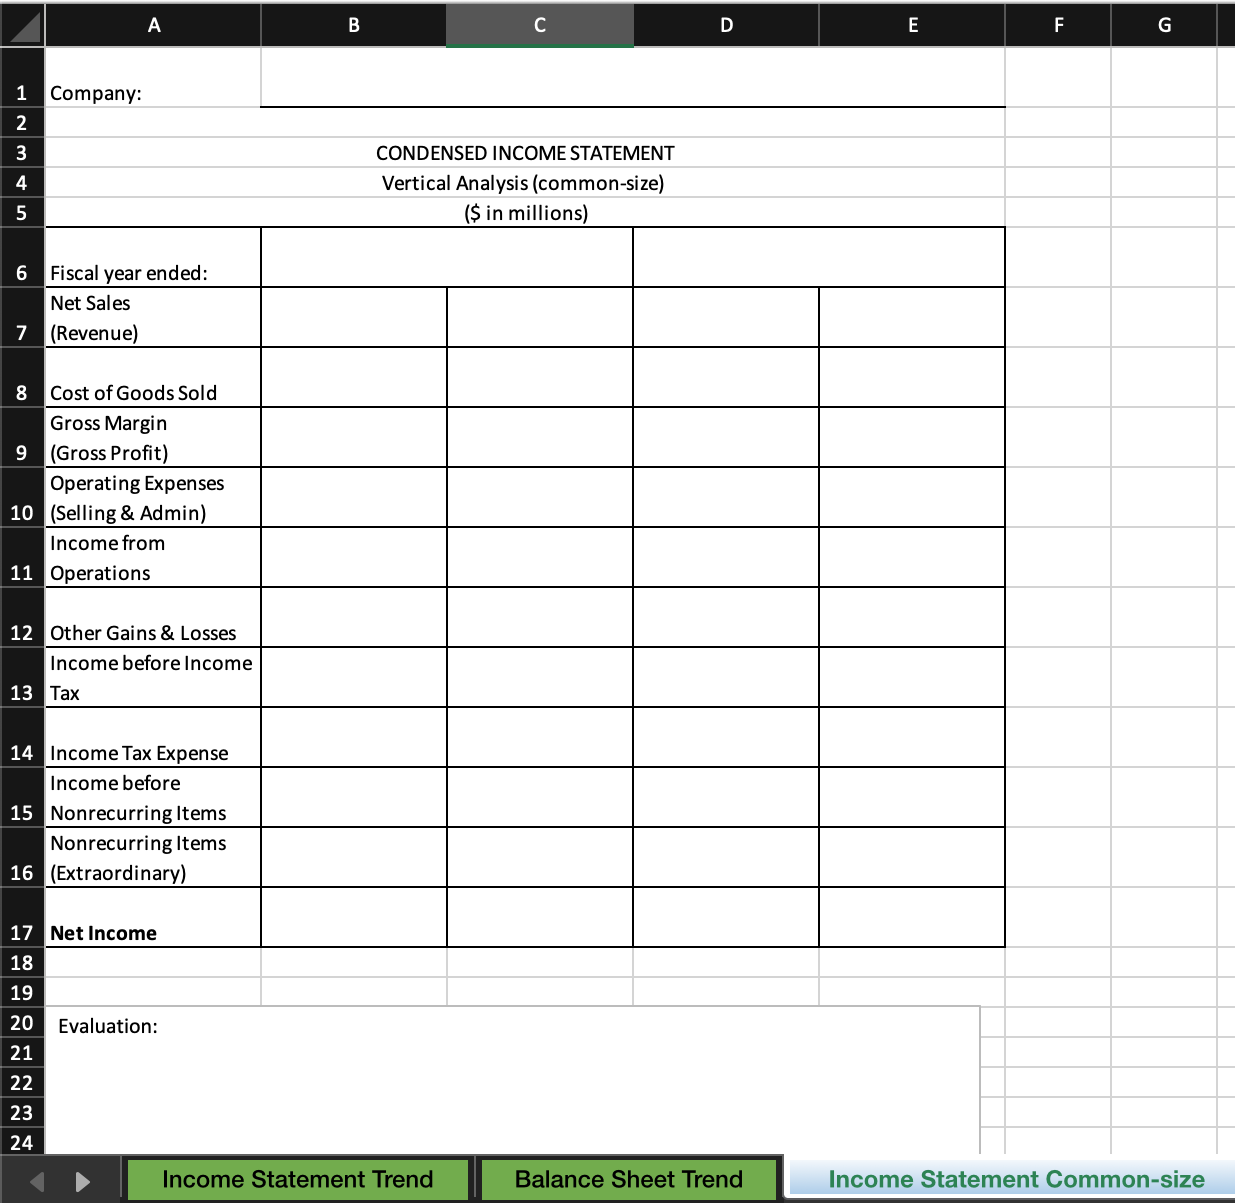
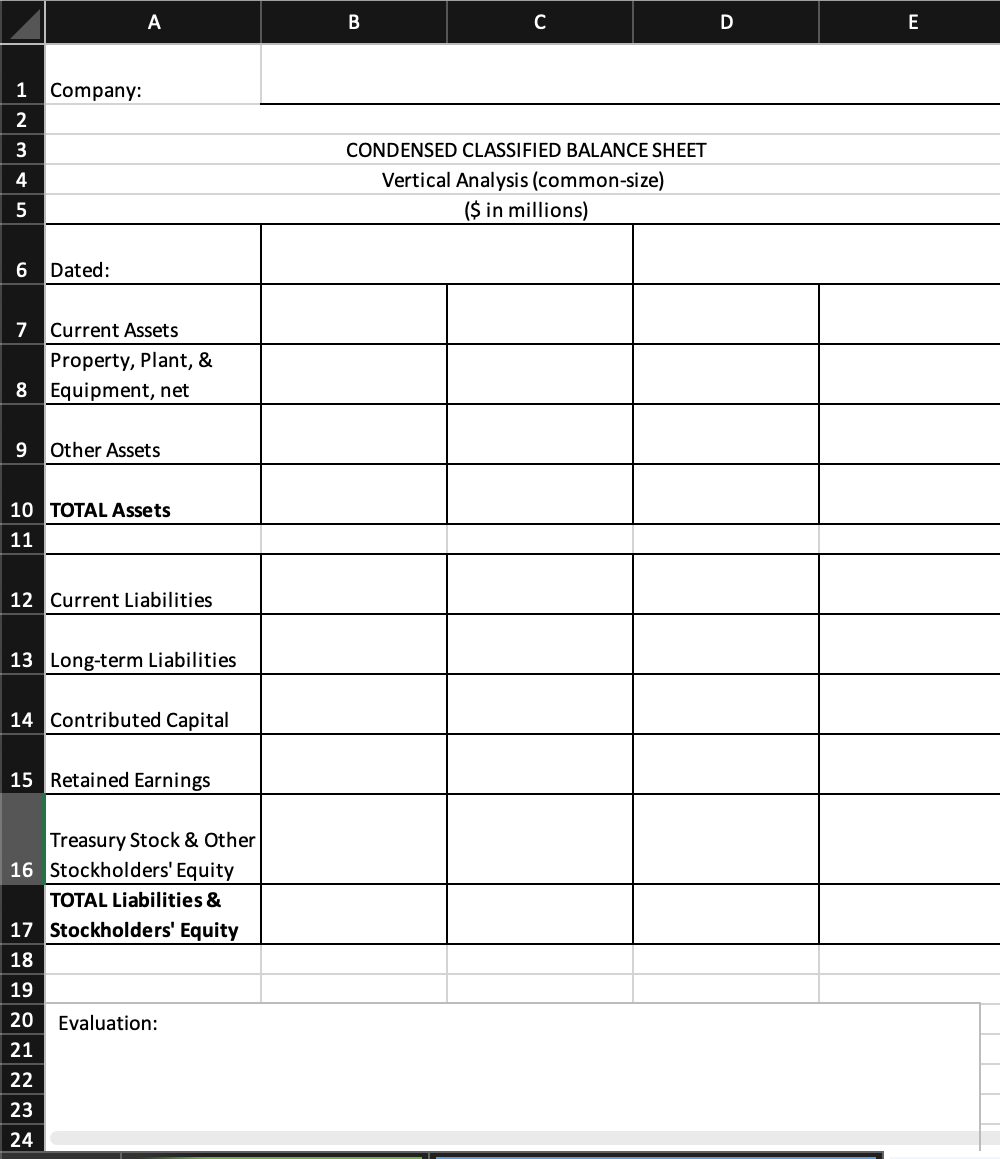
- Horizontal Analysis (income statement & balance sheet)
- Vertical Analysis (income statement & balance sheet)
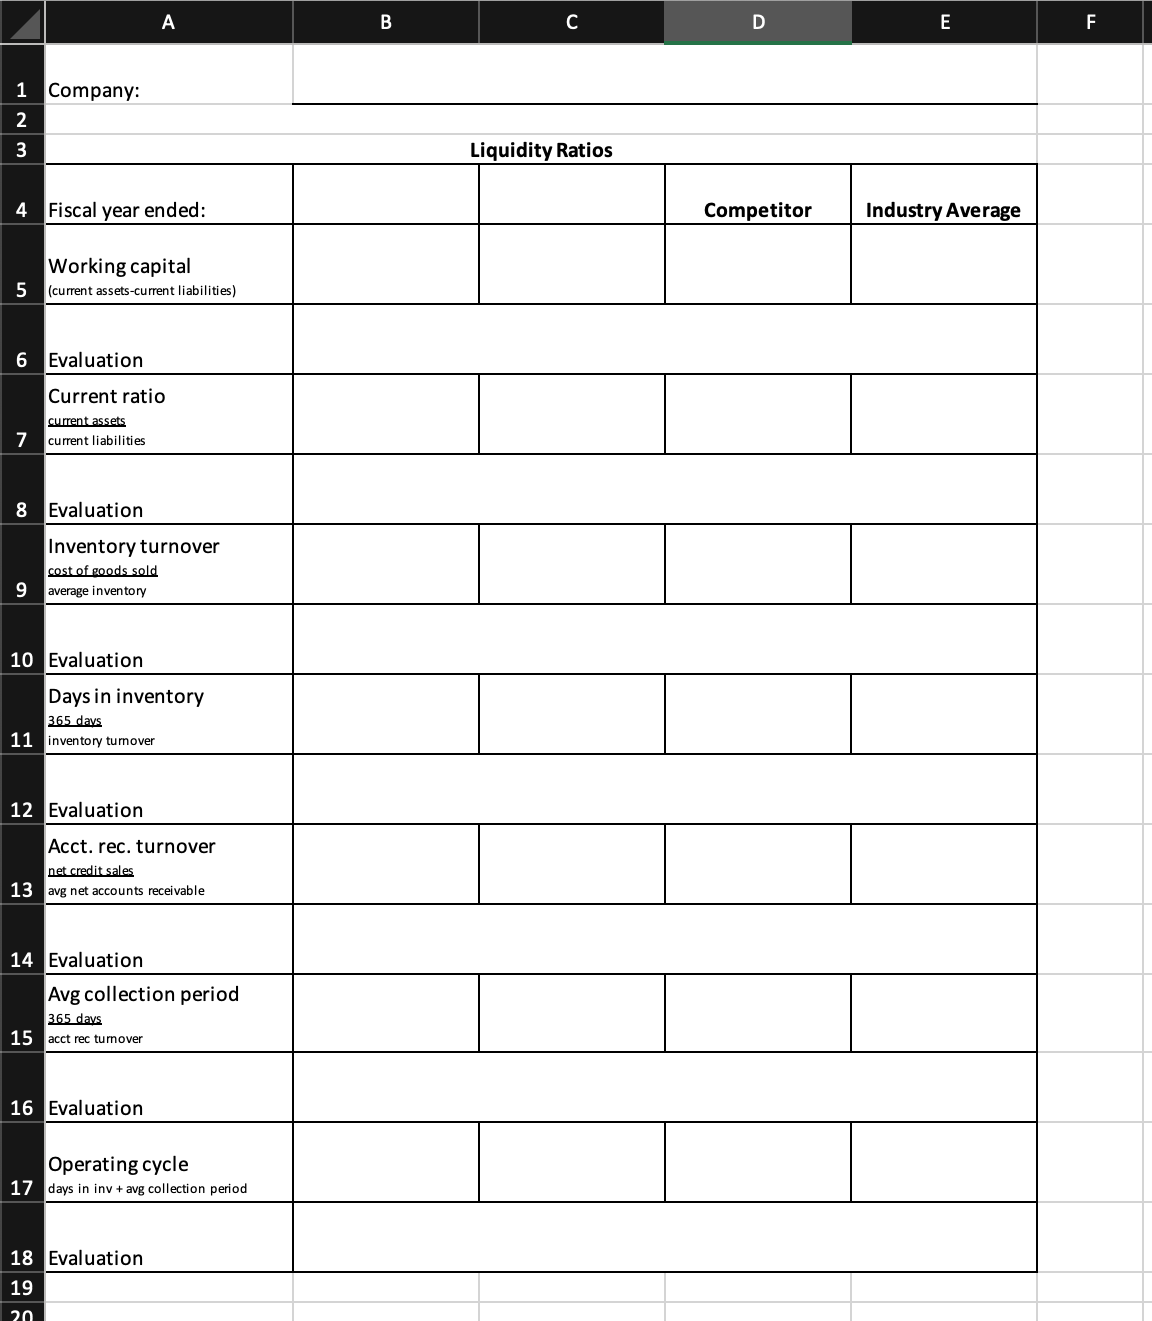
- Liquidity Ratios
- Profitability Ratios
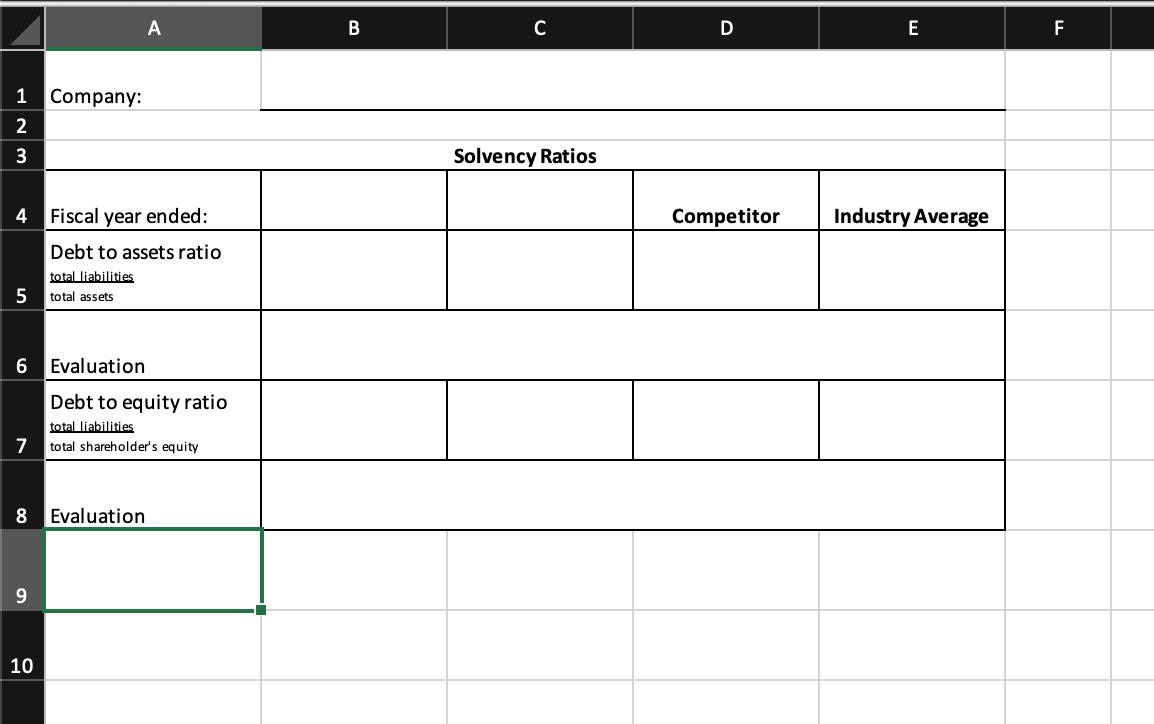
- Solvency Ratios
All templates are below to fill out! Fill out as much as you can!
The information needed to fill out templates:
Answer The Following:
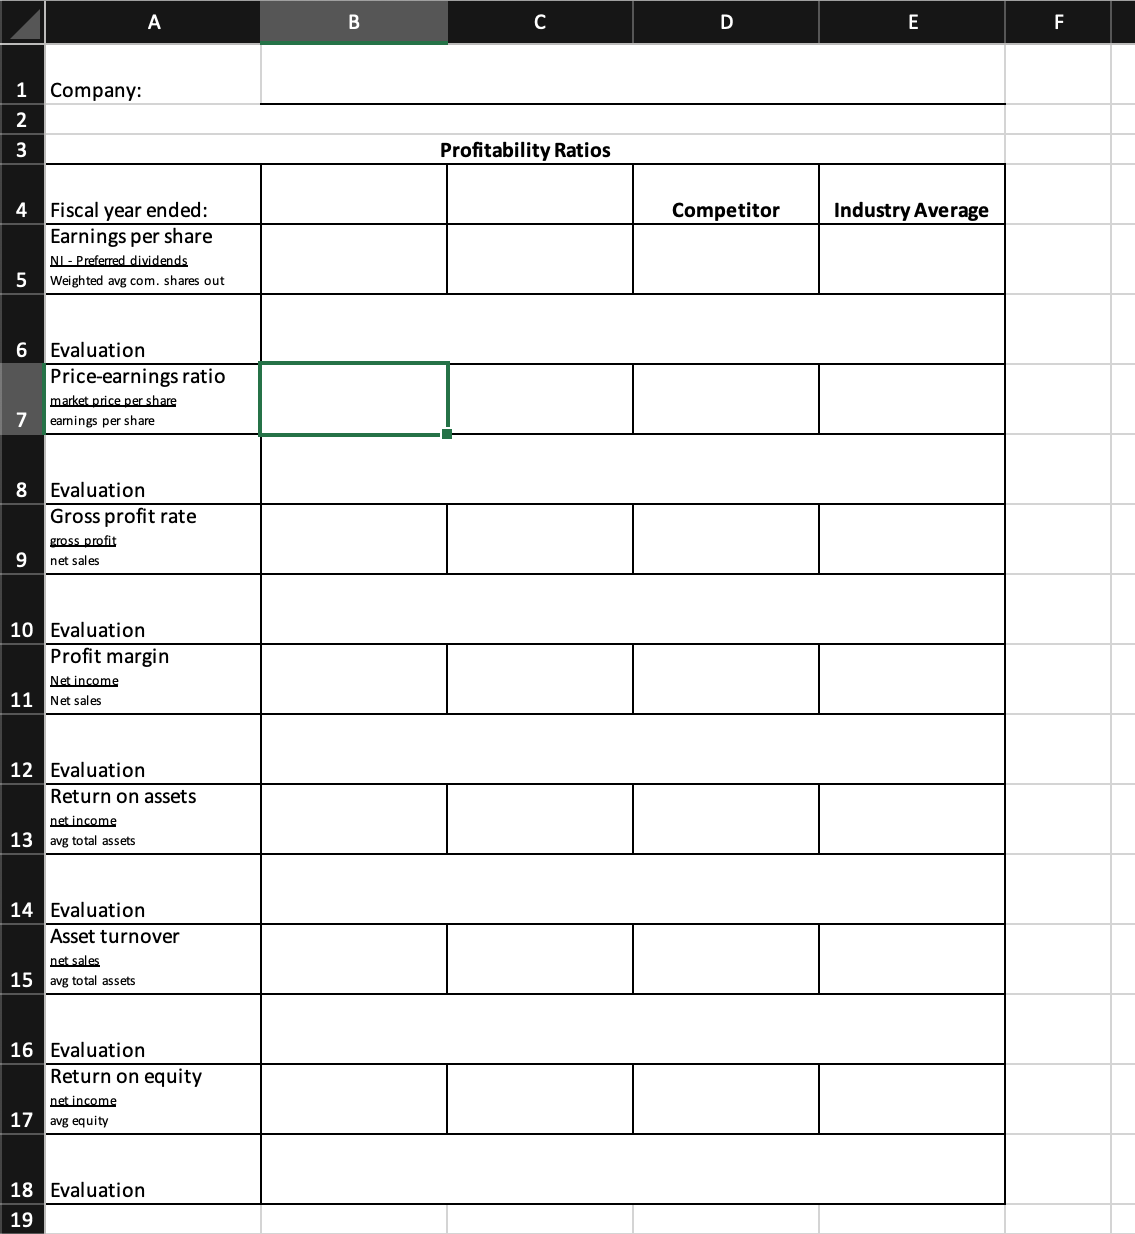
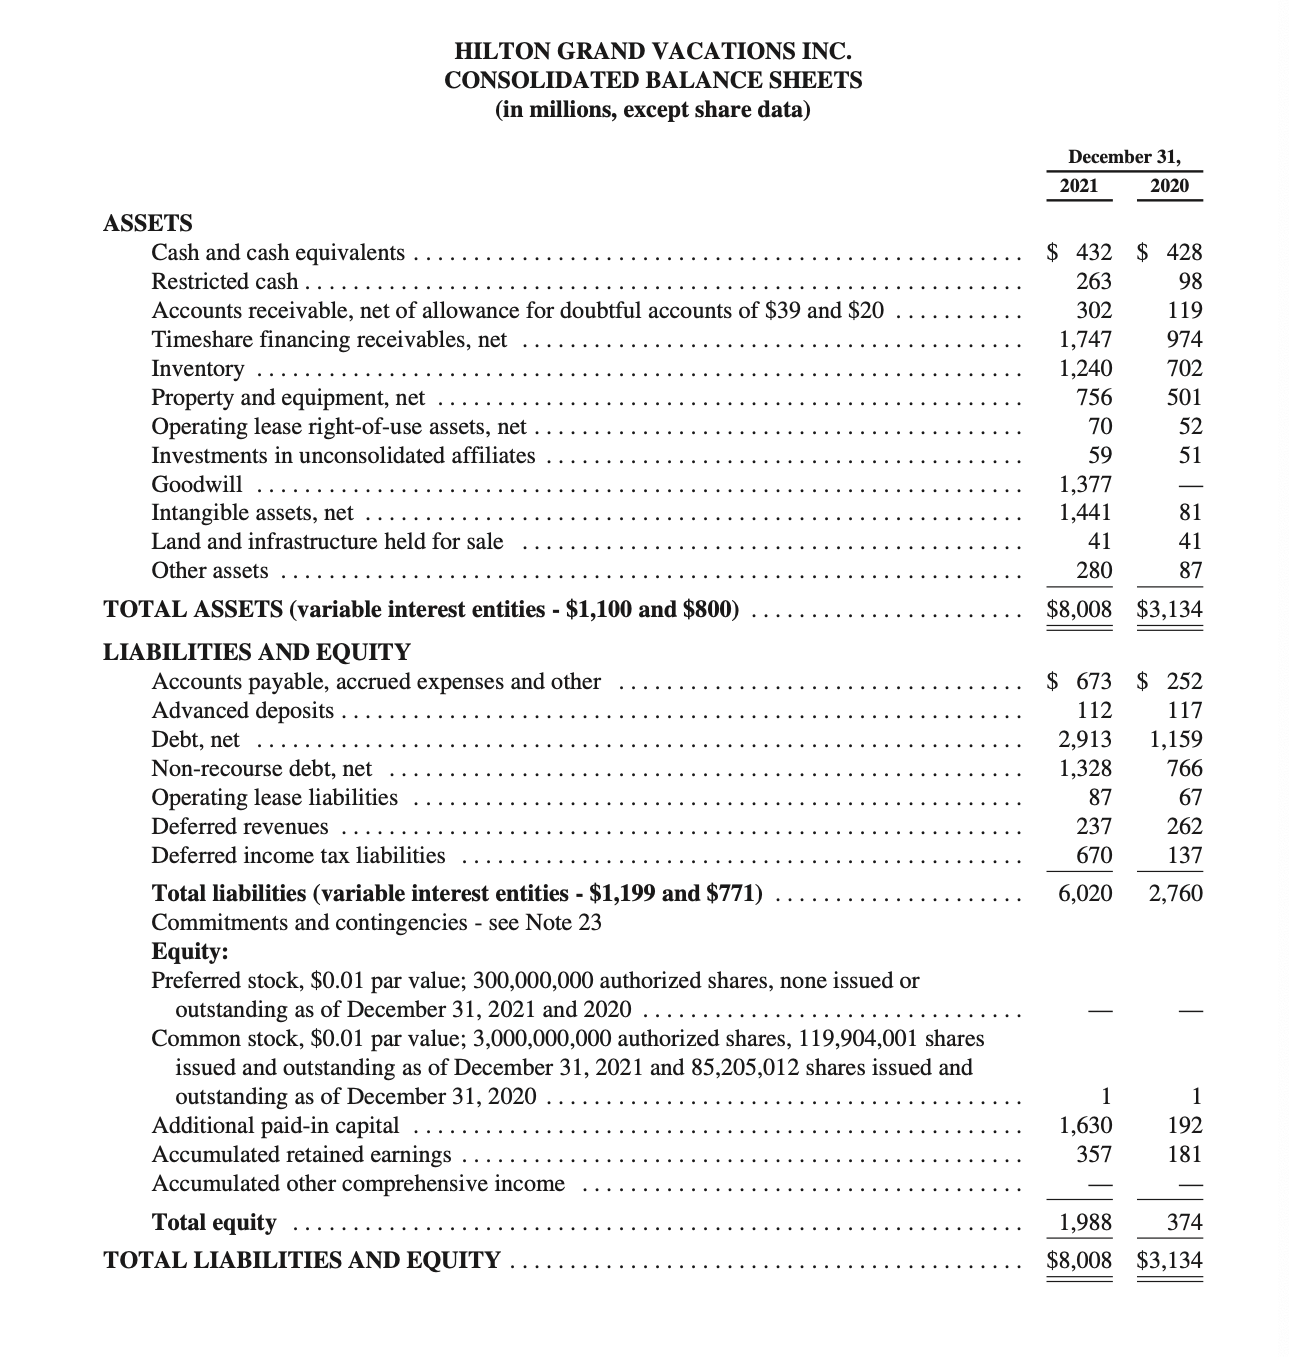
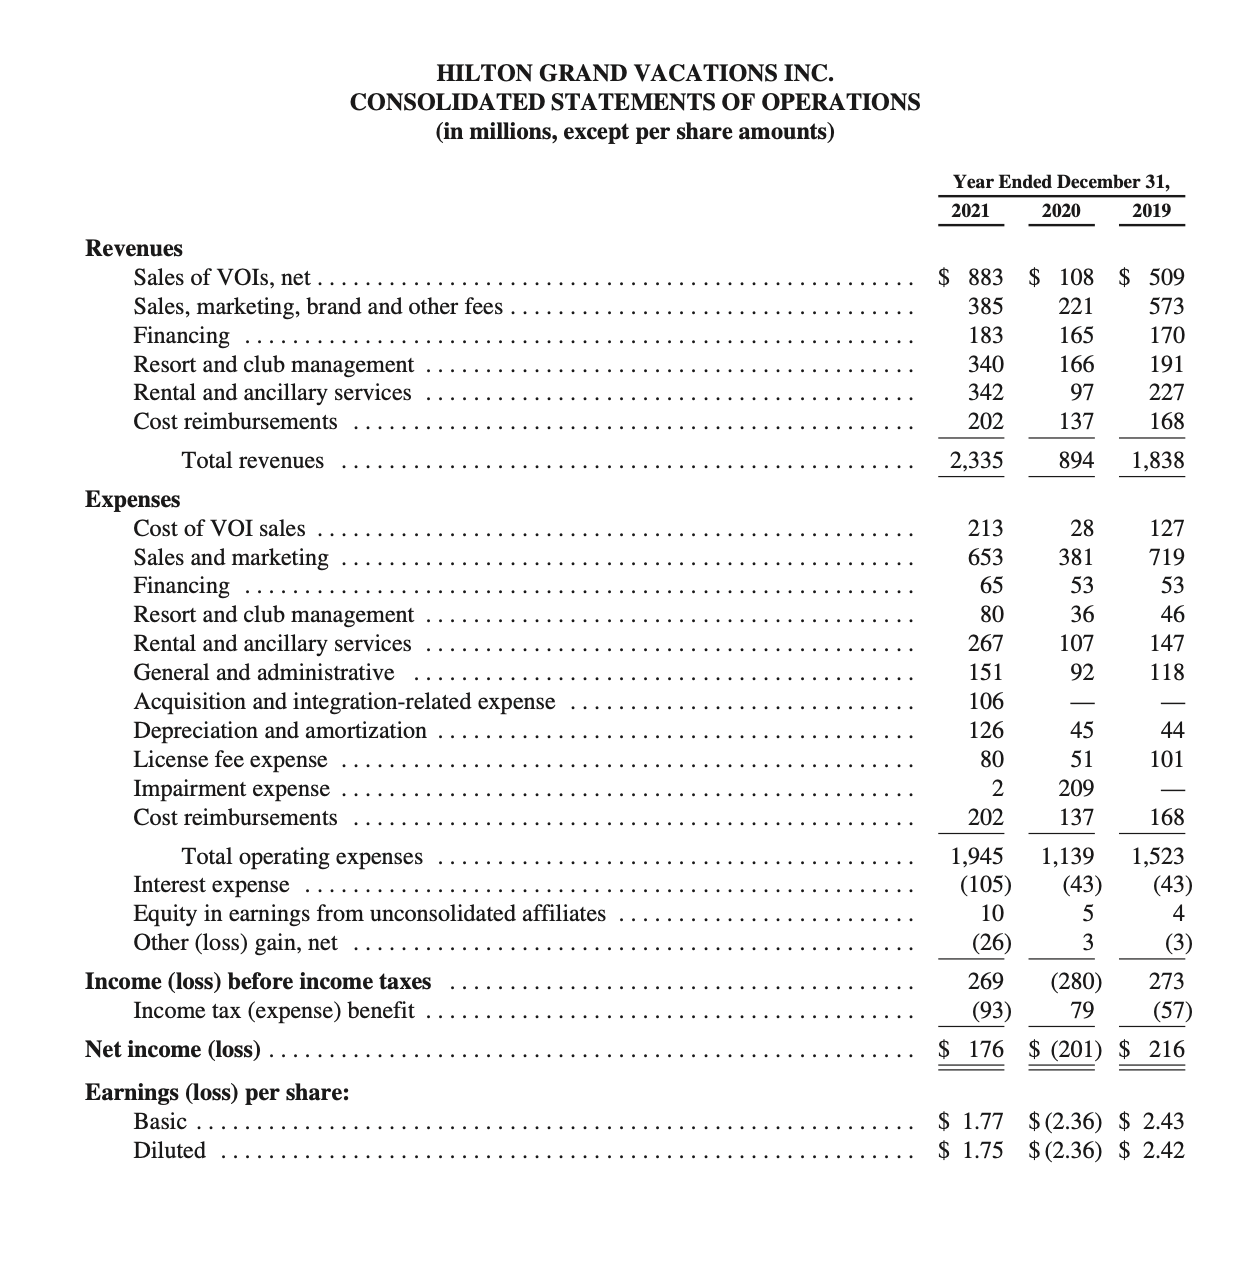
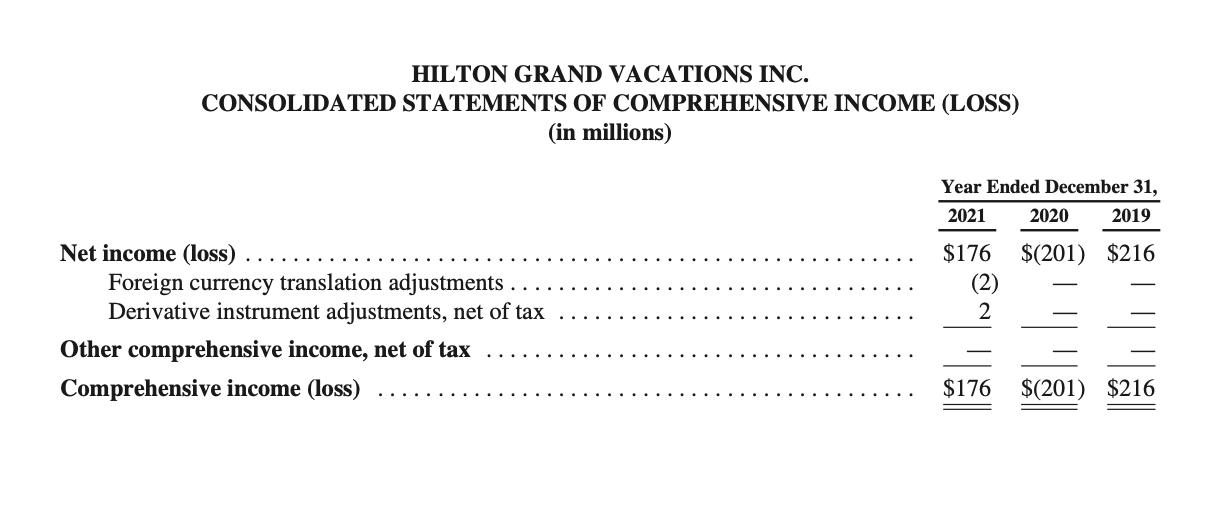
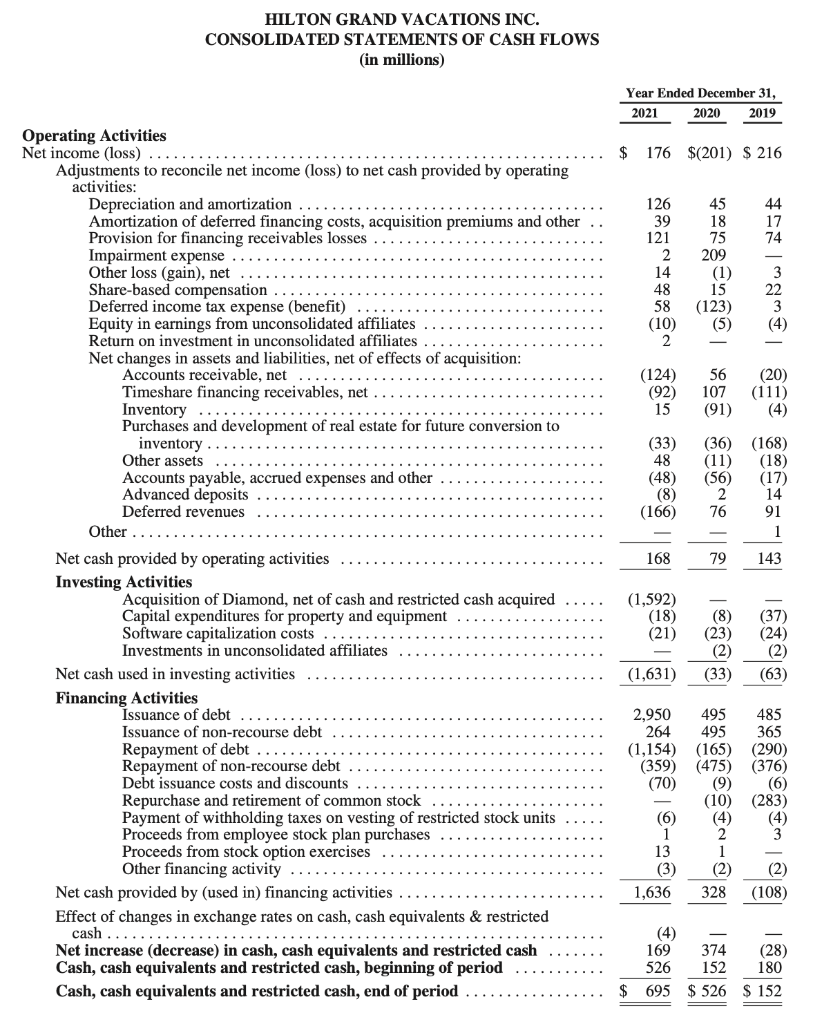
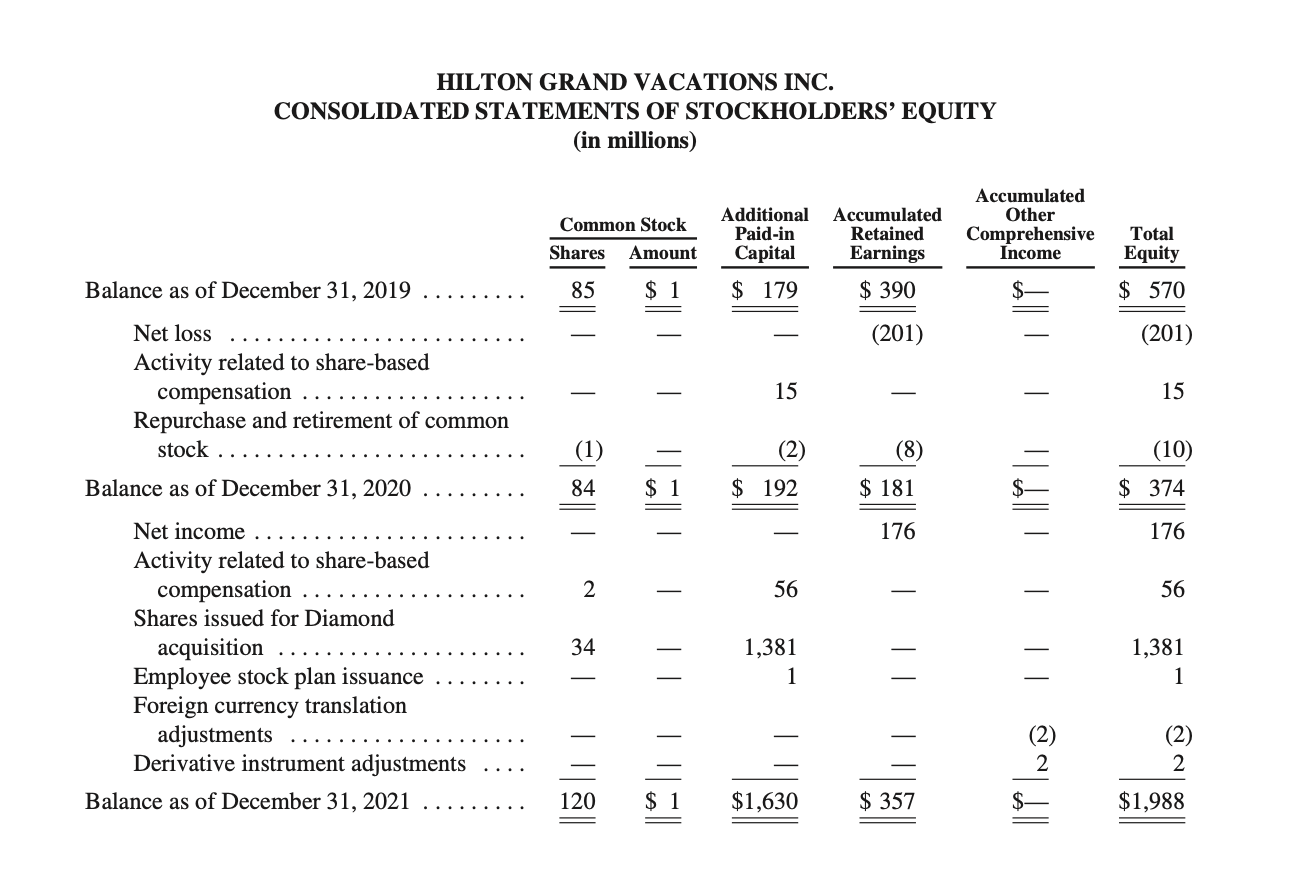
HILTON GRAND VACATIONS INC. CONSOLIDATED BALANCE SHEETS (in millions, except share data) Cash and cash equivalents Restricted cash.. Accounts receivable, net of allowance for doubtful accounts of $39 and $20 Timeshare financing receivables, net Inventory Property and equipment, net Operating lease right-of-use assets, net Investments in unconsolidated affiliates Goodwill Intangible assets, net Land and infrastructure held for sale Other assets TOTAL ASSETS (variable interest entities - $1,100 and $800) LIABILITIES AND EQUITY Accounts payable, accrued expenses and other Advanced deposits Debt, net Non-recourse debt, net Operating lease liabilities Deferred revenues Deferred income tax liabilities Total liabilities (variable interest entities - $1,199 and $771) Commitments and contingencies - see Note 23 Equity: Preferred stock, $0.01 par value; 300,000,000 authorized shares, none issued or outstanding as of December 31, 2021 and 2020 Common stock, $0.01 par value; 3,000,000,000 authorized shares, 119,904,001 shares issued and outstanding as of December 31, 2021 and 85,205,012 shares issued and outstanding as of December 31, 2020 Additional paid-in capital Accumulated retained earnings Accumulated other comprehensive income Total equity TOTAL LIABILITIES AND EQUITY ASSETS December 31, 2021 2020 $ 432 $ 428 263 98 302 119 1,747 974 1,240 702 756 501 70 52 59 51 1,377 1,441 81 41 41 280 87 $8,008 $3,134 $ 673 $ 252 112 117 2,913 1,159 1,328 766 87 67 237 262 670 137 6,020 2,760 1 1 1,630 192 357 181 1,988 374 $8,008 $3,134 Revenues HILTON GRAND VACATIONS INC. CONSOLIDATED STATEMENTS OF OPERATIONS (in millions, except per share amounts) Sales of VOIs, net. Sales, marketing, brand and other fees Financing Resort and club management Rental and ancillary services Cost reimbursements Total revenues Expenses Cost of VOI sales Sales and marketing Financing Resort and club management Rental and ancillary services General and administrative Acquisition and integration-related expense Depreciation and amortization License fee expense Impairment expense Cost reimbursements Total operating expenses Interest expense Equity in earnings from unconsolidated affiliates Other (loss) gain, net Income (loss) before income taxes Income tax (expense) benefit Net income (loss) Earnings (loss) per share: Basic Diluted Year Ended December 31, 2021 2020 2019 $883 $ 108 $ 509 385 221 573 183 165 170 340 166 191 342 97 227 202 137 168 2,335 894 1,838 213 127 653 719 65 53 80 46 267 147 151 118 106 126 44 80 101 2 202 168 1,945 1,523 (105) 10 (26) * - * 5 6 1 4 5 8 5 3 9 (43) 4 (3) 5 3 269 (280) 79 (93) (57) $ 176 $ (201) $ 216 $ 1.77 $(2.36) $ 2.43 $1.75 $(2.36) $ 2.42 273 HILTON GRAND VACATIONS INC. CONSOLIDATED STATEMENTS OF COMPREHENSIVE INCOME (LOSS) (in millions) Net income (loss) Foreign currency translation adjustments Derivative instrument adjustments, net of tax Other comprehensive income, net of tax Comprehensive income (loss) Year Ended December 31, 2021 2020 2019 $176 $(201) $216 $(201) $216 (2) 2 $176 HILTON GRAND VACATIONS INC. CONSOLIDATED STATEMENTS OF CASH FLOWS (in millions) Operating Activities Net income (loss) Adjustments to reconcile net income (loss) to net cash provided by operating activities: Depreciation and amortization Amortization of deferred financing costs, acquisition premiums and other Provision for financing receivables losses Impairment expense Other loss (gain), net Share-based compensation Deferred income tax expense (benefit) Equity in earnings from unconsolidated affiliates Return on investment in unconsolidated affiliates Net changes in assets and liabilities, net of effects of acquisition: Accounts receivable, net Timeshare financing receivables, net Inventory... Purchases and development of real estate for future conversion to inventory Other assets Accounts payable, accrued expenses and other Advanced deposits Deferred revenues Other Net cash provided by operating activities Investing Activities Acquisition of Diamond, net of cash and restricted cash acquired Capital expenditures for property and equipment Software capitalization costs Investments in unconsolidated affiliates Net cash used in investing activities Financing Activities Issuance of debt Issuance of non-recourse debt Repayment of debt Repayment of non-recourse debt Debt issuance costs and discounts Repurchase and retirement of common stock Payment of withholding taxes on vesting of restricted stock units Proceeds from employee stock plan purchases Proceeds from stock option exercises Other financing activity Net cash provided by (used in) financing activities Effect of changes in exchange rates on cash, cash equivalents & restricted cash Net increase (decrease) in cash, cash equivalents and restricted cash Cash, cash equivalents and restricted cash, beginning of period Cash, cash equivalents and restricted cash, end of period Year Ended December 31, 2021 2020 2019 $ 176 $(201) $ 216 Bg~**~ #F#|~8~| 8 8*8*8 || nngi & lR[ lg@@ r-a 52 || 63 43888"|0|8| 188|2|| 080 58001 **|| (92) 107 (36) (168) (359) (475) (376) (4) $526 $152 HILTON GRAND VACATIONS INC. CONSOLIDATED STATEMENTS OF STOCKHOLDERS' EQUITY (in millions) Common Stock Additional Accumulated Paid-in Retained Shares Amount Capital Earnings 85 $ 1 $ 179 $ 390 15 (2) Balance as of December 31, 2019 Net loss Activity related to share-based compensation Repurchase and retirement of common stock Balance as of December 31, 2020 Net income Activity related to share-based compensation Shares issued for Diamond acquisition Employee stock plan issuance Foreign currency translation adjustments Derivative instrument adjustments Balance as of December 31, 2021 | =|*||| 2 34 120 $ 1 $ 1 $ 192 56 1,381 1 $1,630 (201) (8) $ 181 176 $ 357 Accumulated Other Comprehensive Income | | @~||| Total Equity $ 570 (201) 15 (10) $ 374 176 56 1,381 1 (2) 2 $1,988 1 Company: 6 Fiscal year ended: Net Sales 7 (Revenue) 8 Cost of Goods Sold Gross Margin 9 (Gross Profit) Operating Expenses 10 (Selling & Admin) Income from 11 Operations 12 Other Gains & Losses Income before Income 13 Tax 14 Income Tax Expense Income before 15 Nonrecurring Items Nonrecurring Items 16 (Extraordinary) 17 Net Income 18 19 20 21 Evaluation: 22 23 N345 A 2 B CONDENSED INCOME STATEMENT Horizontal Analysis (trend) ($ in millions) Income Statement Trend D Amount of Increase or (Decrease) Balance Sheet Trend F E Percent of Increase or (Decrease) Income Statement C SAWN H 1 Company: 2 3 4 5 A 6 Dated: 7 Current Assets Property, Plant, & 8 Equipment, net 9 Other Assets 10 TOTAL Assets 11 12 Current Liabilities 13 Long-term Liabilities 14 Contributed Capital 15 Retained Earnings Treasury Stock & Other 16 Stockholders' Equity TOTAL Liabilities & 17 Stockholders' Equity 18 19 20 Evaluation: 21 22 23 B C D CONDENSED CLASSIFIED BALANCE SHEET Horizontal Analysis (trend) ($ in millions) Income Statement Trend Amount of Increase or (Decrease) Balance Sheet Trend F E Percent of Increase or (Decrease) Income Statement Comm Company: 2 6 Fiscal year ended: Net Sales 7 (Revenue) 8 Cost of Goods Sold Gross Margin 9 (Gross Profit) Operating Expenses 10 (Selling & Admin) Income from 11 Operations 12 Other Gains & Losses Income before Income 13 Tax 14 Income Tax Expense Income before 15 Nonrecurring Items Nonrecurring Items 16 (Extraordinary) 17 Net Income 18 19 20 Evaluation: 21 22 23 24 SAWN 3 4 A 5 B CONDENSED INCOME STATEMENT Vertical Analysis (common-size) ($ in millions) Income Statement Trend D Balance Sheet Trend E F TI Income Statement Common-size A Company: 2 6 Dated: 7 8 Equipment, net 9 Other Assets 10 TOTAL Assets 11 12 Current Liabilities 13 Long-term Liabilities 14 Contributed Capital 15 Retained Earnings Treasury Stock & Other 16 Stockholders' Equity TOTAL Liabilities & 17 Stockholders' Equity 18 19 20 Evaluation: 21 22 23 24 SAWN Current Assets Property, Plant, & B D CONDENSED CLASSIFIED BALANCE SHEET Vertical Analysis (common-size) ($ in millions) E 723 A 1 Company: 4 Fiscal year ended: Working capital 5 (current assets-current liabilities) 6 Evaluation Current ratio current assets 7 current liabilities 8 Evaluation Inventory turnover cost of goods sold 9 average inventory 10 Evaluation Days in inventory 365 days 11 inventory tumover 12 Evaluation Acct. rec. turnover net credit sales 13 avg net accounts receivable 14 Evaluation Avg collection period 365 days 15 acct rec turnover 16 Evaluation Operating cycle 17 days in inv + avg collection period 18 Evaluation 19 20 B Liquidity Ratios D Competitor E Industry Average F 723 1 A Company: 4 Fiscal year ended: Debt to assets ratio total liabilities 5 total assets 6 Evaluation Debt to equity ratio total liabilities 7 total shareholder's equity 8 Evaluation 9 10 B C Solvency Ratios D Competitor E Industry Average F 1 Company: 2 WIT 3 A 4 Fiscal year ended: Earnings per share NI - Preferred dividends 5 Weighted avg com. shares out 6 Evaluation Price-earnings ratio market price per share earnings per share 7 8 Evaluation Gross profit rate gross profit 9 net sales 10 Evaluation Profit margin Net income 11 Net sales 12 Evaluation Return on assets net income 13 avg total assets 14 Evaluation 15 avg total assets 16 Evaluation Return on equity net income 17 avg equity 18 Evaluation 19 Asset turnover net sales B Profitability Ratios D Competitor E Industry Average F