

Answered step by step
Verified Expert Solution
Question
1 Approved Answer
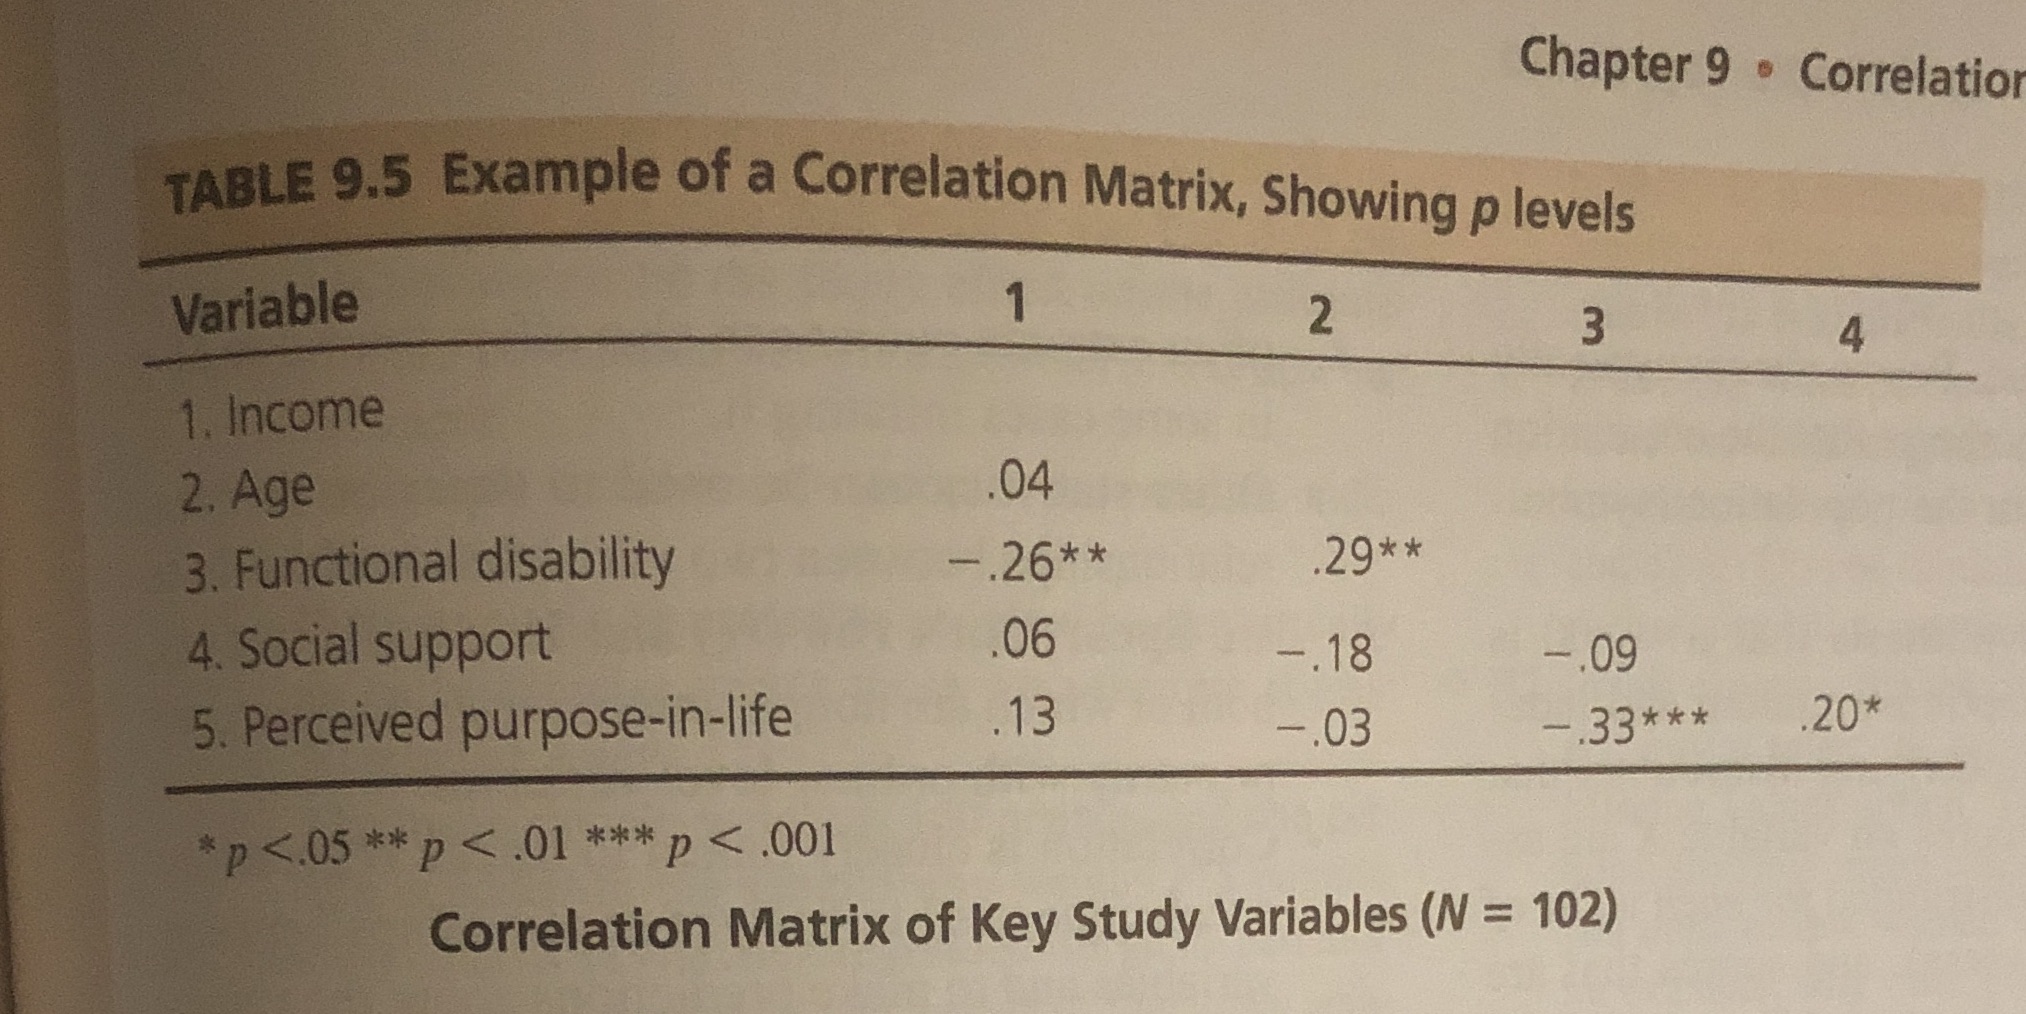
Write 2 research questions based on the variables in the table and answer them using the statistics provided. Could you come up with some explanations
Write 2 research questions based on the variables in the table and answer them using the statistics provided. Could you come up with some explanations for the results?
Step by Step Solution
There are 3 Steps involved in it
Step: 1

Get Instant Access to Expert-Tailored Solutions
See step-by-step solutions with expert insights and AI powered tools for academic success
Step: 2

Step: 3
Ace Your Homework with AI
Get the answers you need in no time with our AI-driven, step-by-step assistance
Get Started
Finite Math And Applied Calculus
Authors: Stefan Waner, Steven Costenoble
7th Edition
1337515566, 9781337515566