Write a a review of Brinker International, Inc. (EAT) financial statements, including the balance sheet and the income statement, using the most recent three years of financial statements (2017-2019), noting any trends in revenues, expenses, assets, liabilities, etc.
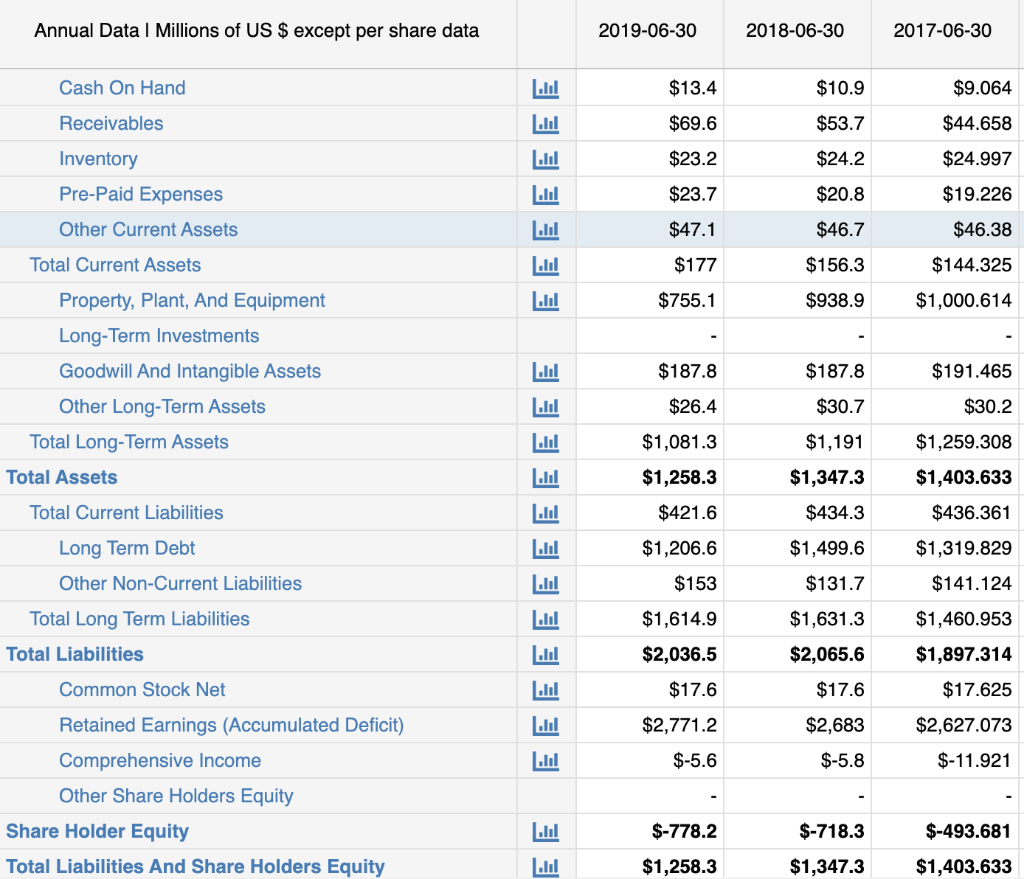
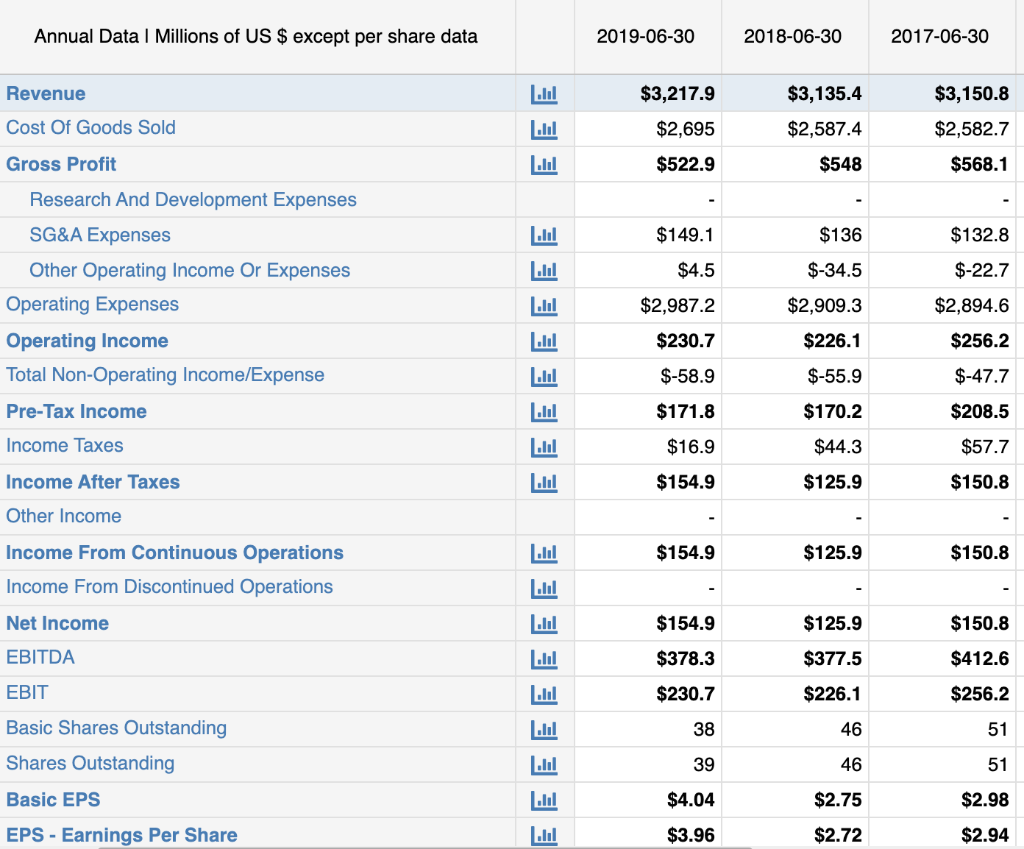
Annual Data 1 Millions of US $ except per share data 2019-06-30 2018-06-30 2017-06-30 Cash On Hand $13.4 $10.9 $9.064 Receivables $69.6 $53.7 $44.658 $23.2 $24.2 $24.997 Inventory Pre-Paid Expenses E E E E E E E $23.7 $20.8 $19.226 Other Current Assets $47.1 $46.7 $46.38 $177 $156.3 $144.325 $755.1 $938.9 $1,000.614 Total Current Assets Property, Plant, And Equipment Long-Term Investments Goodwill And Intangible Assets Other Long-Term Assets Total Long-Term Assets Total Assets IIII $187.8 $187.8 $191.465 Ill $26.4 $30.7 $30.2 LUI $1,081.3 $1,191 $1,259.308 Ill $1,258.3 $1,347.3 $1,403.633 $436.361 Total Current Liabilities Ill $421.6 $434.3 Long Term Debt $1,206.6 $1,499.6 $1,319.829 $153 $131.7 $141.124 Other Non-Current Liabilities Total Long Term Liabilities Total Liabilities lil Ilil $1,614.9 $1,631.3 $1,460.953 Ilil $2,036.5 $2,065.6 $1,897.314 Common Stock Net $17.6 $17.6 $17.625 ...1 $2,771.2 $2,683 $2,627.073 E $-5.6 $-5.8 $-11.921 Retained Earnings (Accumulated Deficit) Comprehensive Income Other Share Holders Equity Share Holder Equity Total Liabilities And Share Holders Equity $-778.2 $-718.3 $-493.681 $1,258.3 $1,347.3 $1,403.633 Annual Data 1 Millions of US $ except per share data 2019-06-30 2018-06-30 2017-06-30 Revenue $3,217.9 $3,135.4 $3,150.8 Cost Of Goods Sold EE E $2,695 $2,587.4 $2,582.7 Gross Profit $522.9 $548 $568.1 $149.1 $136 $132.8 $4.5 $-34.5 $-22.7 Research And Development Expenses SG&A Expenses Other Operating Income Or Expenses Operating Expenses Operating Income Total Non-Operating Income/Expense $2,987.2 $2,909.3 $2,894.6 $230.7 $226.1 $256.2 LUI $-58.9 $-55.9 $-47.7 Pre-Tax Income $171.8 $170.2 $208.5 Income Taxes Lul $16.9 $44.3 $57.7 Income After Taxes LUI $154.9 $125.9 $150.8 Other Income $154.9 $125.9 $150.8 Income From Continuous Operations Income From Discontinued Operations Net Income $154.9 $125.9 $150.8 EBITDA $378.3 $377.5 $412.6 E E E E E E E E E $230.7 $226.1 $256.2 EBIT Basic Shares Outstanding Shares Outstanding 38 46 51 39 46 51 Basic EPS $4.04 $2.75 $2.98 EPS - Earnings Per Share $3.96 $2.72 $2.94