Write a brief analysis of the three inventory policies depicted in the budget scenario A and recommend a policy that the company should implement. Give reasons for your recommendation. Your write-up should be based on the results you obtained from the analyses in steps 1-5 above for scenario A. Assume that you are writing on behalf of a professional consultant advising the President of the company about the companys inventory policies.
Your write-up should be in the form of a one-page Memo to the President of the company. Organization, grammar, and spelling are important.
SCENARIO A) (50% Ending Inventory)
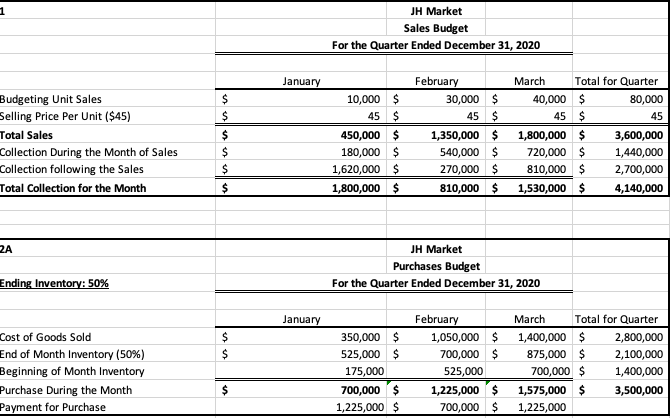
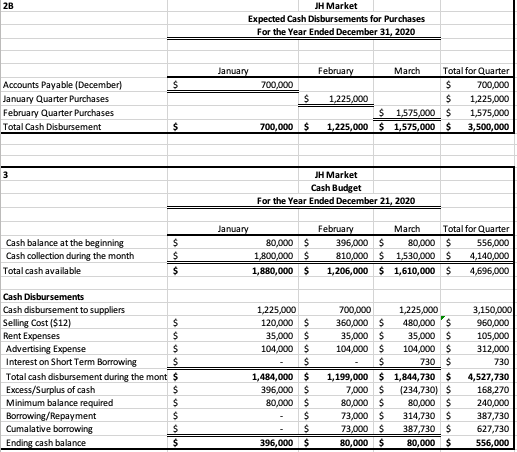
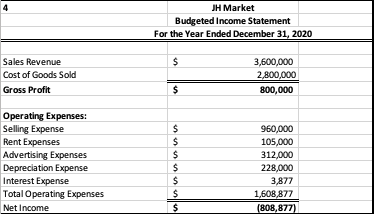
1 JH Market Sales Budget For the Quarter Ended December 31, 2020 January Budgeting Unit Sales Selling Price Per Unit ($45) Total Sales Collection During the Month of Sales Collection following the Sales Total Collection for the Month $ $ $ $ $ $ February March Total for Quarter 10,000 $ 30,000 $ 40,000 $ 80,000 45 $ 45 $ 45 $ 45 450,000 $ 1,350,000 $ 1,800,000 $ 3,600,000 180,000 $ 540,000 $ 720,000 $ 1,440,000 1,620,000 $ 270,000 $ 810,000 $ 2,700,000 1,800,000 $ 810,000 $ 1,530,000 $ 4,140,000 2A JH Market Purchases Budget For the Quarter Ended December 31, 2020 Ending Inventory: 50% January $ $ Cost of Goods Sold End of Month Inventory (50%) Beginning of Month Inventory Purchase During the Month Payment for Purchase 350,000 $ 525,000 $ 175,000 700,000 $ 1,225,000 $ February March Total for Quarter 1,050,000 $ 1,400,000 $ 2,800,000 700,000 $ 875,000 $ 2,100,000 525,000 700,000 $ 1,400,000 1,225,000 $ 1,575,000 $ 3,500,000 700,000 $1,225,000 $ 2B JH Market Expected Cash Disbursements for Purchases For the Year Ended December 31, 2020 January $ 700,000 $ Accounts Payable (December) January Quarter Purchases February Quarter Purchases Total Cash Disbursement February March Total for Quarter $ 700,000 1,225,000 $ 1,225,000 $ 1,575,000 $ 1,575,000 1,225,000 $1,575,000 $ 3,500,000 $ 700,000 $ 3 JH Market Cash Budget For the Year Ended December 21, 2020 Cash balance at the beginning Cash collection during the month Total cash available $ $ $ January 80,000 $ 1,800,000 $ 1,880,000 $ February March Total for Quarter 396,000 $ 80,000 $ 556,000 810,000 $ 1,530,000 $ 4,140,000 1,206,000 $1,610,000 $ 4,696,000 Cash Disbursements Cash disbursement to suppliers Selling Cost ($12) $ Rent Expenses $ Advertising Expense $ Interest on Short Term Borrowing $ Total cash disbursement during the mont $ Excess/Surplus of cash $ Minimum balance required $ Borrowing/Repayment $ Cumalative borrowing $ Ending cash balance $ 1,225,000 120,000 $ 35,000 $ 104,000 $ $ 1,484,000 $ 396,000 $ 80,000 $ $ $ 396,000 $ 700,000 1,225,000 360,000 $ 480,000 $ 35,000 $ 35,000 $ 104,000 $ 104,000 $ $ 730 $ 1,199,000 $ 1,844,730 $ 7,000 $ (234,730) $ 80,000 $ 80,000 $ 73,000 $ 314,730 $ 73,000 $ 387,730 $ 80,000 $ 80,000 $ 3,150,000 960,000 105,000 312,000 730 4,527,730 168,270 240,000 387,730 627,730 556,000 4 JH Market Budgeted Income Statement For the Year Ended December 31, 2020 $ Sales Revenue Cost of Goods Sold Gross Profit 3,600,000 2,800,000 800,000 $ $ Operating Expenses: Selling Expense Rent Expenses Advertising Expenses Depreciation Expense Interest Expense Total Operating Expenses Net Income $ $ $ $ $ $ $ $ 960,000 105,000 312,000 228,000 3,877 1,608,877 (808,877) 1 JH Market Sales Budget For the Quarter Ended December 31, 2020 January Budgeting Unit Sales Selling Price Per Unit ($45) Total Sales Collection During the Month of Sales Collection following the Sales Total Collection for the Month $ $ $ $ $ $ February March Total for Quarter 10,000 $ 30,000 $ 40,000 $ 80,000 45 $ 45 $ 45 $ 45 450,000 $ 1,350,000 $ 1,800,000 $ 3,600,000 180,000 $ 540,000 $ 720,000 $ 1,440,000 1,620,000 $ 270,000 $ 810,000 $ 2,700,000 1,800,000 $ 810,000 $ 1,530,000 $ 4,140,000 2A JH Market Purchases Budget For the Quarter Ended December 31, 2020 Ending Inventory: 50% January $ $ Cost of Goods Sold End of Month Inventory (50%) Beginning of Month Inventory Purchase During the Month Payment for Purchase 350,000 $ 525,000 $ 175,000 700,000 $ 1,225,000 $ February March Total for Quarter 1,050,000 $ 1,400,000 $ 2,800,000 700,000 $ 875,000 $ 2,100,000 525,000 700,000 $ 1,400,000 1,225,000 $ 1,575,000 $ 3,500,000 700,000 $1,225,000 $ 2B JH Market Expected Cash Disbursements for Purchases For the Year Ended December 31, 2020 January $ 700,000 $ Accounts Payable (December) January Quarter Purchases February Quarter Purchases Total Cash Disbursement February March Total for Quarter $ 700,000 1,225,000 $ 1,225,000 $ 1,575,000 $ 1,575,000 1,225,000 $1,575,000 $ 3,500,000 $ 700,000 $ 3 JH Market Cash Budget For the Year Ended December 21, 2020 Cash balance at the beginning Cash collection during the month Total cash available $ $ $ January 80,000 $ 1,800,000 $ 1,880,000 $ February March Total for Quarter 396,000 $ 80,000 $ 556,000 810,000 $ 1,530,000 $ 4,140,000 1,206,000 $1,610,000 $ 4,696,000 Cash Disbursements Cash disbursement to suppliers Selling Cost ($12) $ Rent Expenses $ Advertising Expense $ Interest on Short Term Borrowing $ Total cash disbursement during the mont $ Excess/Surplus of cash $ Minimum balance required $ Borrowing/Repayment $ Cumalative borrowing $ Ending cash balance $ 1,225,000 120,000 $ 35,000 $ 104,000 $ $ 1,484,000 $ 396,000 $ 80,000 $ $ $ 396,000 $ 700,000 1,225,000 360,000 $ 480,000 $ 35,000 $ 35,000 $ 104,000 $ 104,000 $ $ 730 $ 1,199,000 $ 1,844,730 $ 7,000 $ (234,730) $ 80,000 $ 80,000 $ 73,000 $ 314,730 $ 73,000 $ 387,730 $ 80,000 $ 80,000 $ 3,150,000 960,000 105,000 312,000 730 4,527,730 168,270 240,000 387,730 627,730 556,000 4 JH Market Budgeted Income Statement For the Year Ended December 31, 2020 $ Sales Revenue Cost of Goods Sold Gross Profit 3,600,000 2,800,000 800,000 $ $ Operating Expenses: Selling Expense Rent Expenses Advertising Expenses Depreciation Expense Interest Expense Total Operating Expenses Net Income $ $ $ $ $ $ $ $ 960,000 105,000 312,000 228,000 3,877 1,608,877 (808,877)