Answered step by step
Verified Expert Solution
Link Copied!

Question

1 Approved Answer

Write a code in R PROGRAM to solve this 7) The list below provides snowfall data for 50 consecutive years in Buffalo, NY (in inches

Write a code in R PROGRAM to solve thisimage text in transcribed

7) The list below provides snowfall data for 50 consecutive years in Buffalo, NY (in inches per year). The data have been rearranged in order of increasing annual snowfall. Create two histograms for these data (you may use MATLAB): The first should use classes (bins) of width 20 in, the second should use classes of width 10 in. Do the two histograms give different impressions of the dataset? 25.0 38.8 39.9 40.1 46.7 49.1 49.6 51.1 51.6 53.5 54.7 55.5 55.9 58.8 60.3 63.6 65.4 66.1 69.3 70.9 71.4 71.5 71.8 72.9 74.4 76.2 77.8 78.1 78.4 79.0 79.3 79.7 80.7 82.4 82.4 83.0 83.6 83.6 84.8 85.5 87.4 88.7 89.6 89.8 89.9 90.9 97.0 98.3 101.4 102.4 103.9 104.5 105.2 110.0 110.5 110.5 113.7 114.5 115.6 120.5 120.7 124.7 126.4

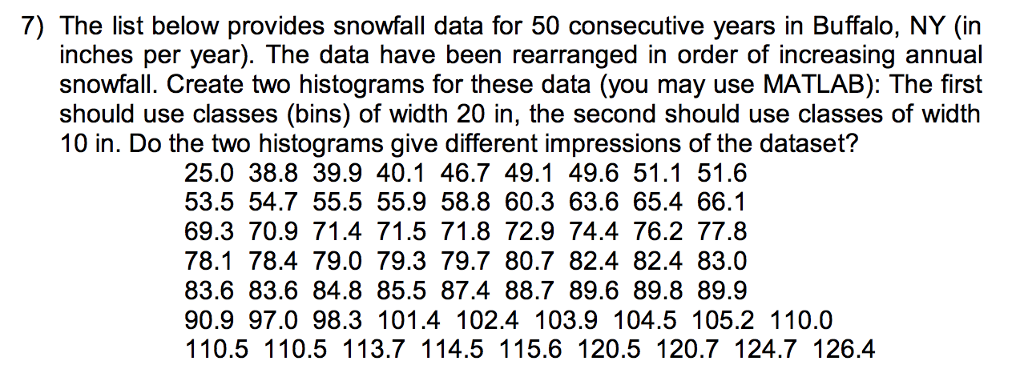
Step by Step Solution

There are 3 Steps involved in it

Step: 1

blur-text-image

Get Instant Access to Expert-Tailored Solutions

See step-by-step solutions with expert insights and AI powered tools for academic success

Step: 2

blur-text-image

Step: 3

blur-text-image

Ace Your Homework with AI

Get the answers you need in no time with our AI-driven, step-by-step assistance

Get Started

Recommended Textbook for

Understanding Oracle APEX 5 Application Development

Authors: Edward Sciore

2nd Edition

1484209893, 9781484209899

Students also viewed these Databases questions