 Write a Matlab function, called Lagrange_poly that inputs a set of data points datx and daty
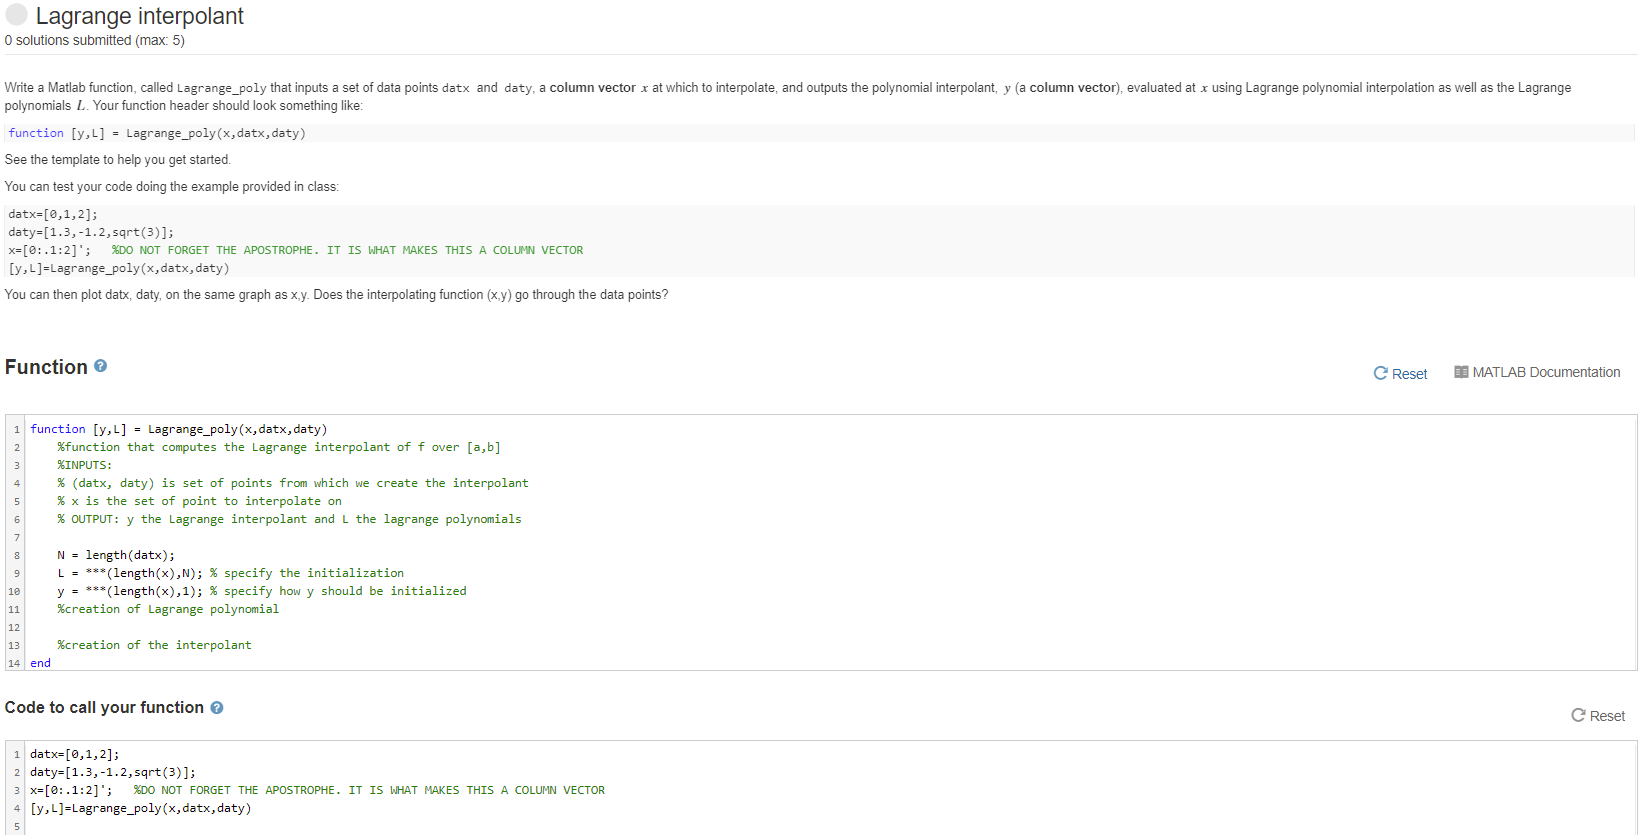
Lagrange interpolant O solutions submitted (max: 5) Write a Matlab function, called Lagrange_poly that inputs a set of data points datx and daty, a column vector x at which to interpolate, and outputs the polynomial interpolant, y (a column vector), evaluated at x using Lagrange polynomial interpolation as well as the Lagrange polynomials L. Your function header should look something like: function [y,L] = Lagrange_poly(x,datx, daty) See the template to help you get started. You can test your code doing the example provided in class: datx=[0,1,2]; daty=[1.3,-1.2,sqrt(3)]; x=[0:.1:2]'; %DO NOT FORGET THE APOSTROPHE. IT IS WHAT MAKES THIS A COLUMN VECTOR [y,L]=Lagrange_poly(x, datx, daty) You can then plot datx, daty, on the same graph as x,y. Does the interpolating function (x,y) go through the data points? Function Reset MATLAB Documentation 1 function [y,L] = Lagrange_poly(x, datx, daty) %function that computes the Lagrange interpolant of f over [a,b] %INPUTS: % (datx, daty) is set of points from which we create the interpolant % x is the set of point to interpolate on % OUTPUT: y the Lagrange interpolant and I the lagrange polynomials N = length(datx); L = ***(length(x),N); % specify the initialization y = ***(length(x),1); % specify how y should be initialized %creation of Lagrange polynomial 10 11 12 13 14 end %creation of the interpolant Code to call your function e Reset datx=[0,1,2]; daty=[1.3,-1.2,sqrt(3)]; 3 X=[0:.1:2]'; %DO NOT FORGET THE APOSTROPHE. IT IS WHAT MAKES THIS A COLUMN VECTOR 4 [y,L]=Lagrange_poly(x,datx, daty) Lagrange interpolant O solutions submitted (max: 5) Write a Matlab function, called Lagrange_poly that inputs a set of data points datx and daty, a column vector x at which to interpolate, and outputs the polynomial interpolant, y (a column vector), evaluated at x using Lagrange polynomial interpolation as well as the Lagrange polynomials L. Your function header should look something like: function [y,L] = Lagrange_poly(x,datx, daty) See the template to help you get started. You can test your code doing the example provided in class: datx=[0,1,2]; daty=[1.3,-1.2,sqrt(3)]; x=[0:.1:2]'; %DO NOT FORGET THE APOSTROPHE. IT IS WHAT MAKES THIS A COLUMN VECTOR [y,L]=Lagrange_poly(x, datx, daty) You can then plot datx, daty, on the same graph as x,y. Does the interpolating function (x,y) go through the data points? Function Reset MATLAB Documentation 1 function [y,L] = Lagrange_poly(x, datx, daty) %function that computes the Lagrange interpolant of f over [a,b] %INPUTS: % (datx, daty) is set of points from which we create the interpolant % x is the set of point to interpolate on % OUTPUT: y the Lagrange interpolant and I the lagrange polynomials N = length(datx); L = ***(length(x),N); % specify the initialization y = ***(length(x),1); % specify how y should be initialized %creation of Lagrange polynomial 10 11 12 13 14 end %creation of the interpolant Code to call your function e Reset datx=[0,1,2]; daty=[1.3,-1.2,sqrt(3)]; 3 X=[0:.1:2]'; %DO NOT FORGET THE APOSTROPHE. IT IS WHAT MAKES THIS A COLUMN VECTOR 4 [y,L]=Lagrange_poly(x,datx, daty)