

Answered step by step
Verified Expert Solution
Question
1 Approved Answer
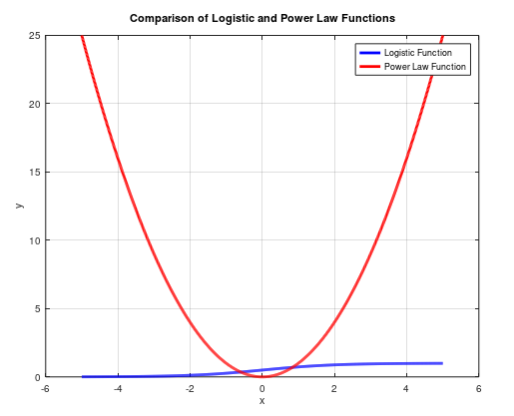
Write a MATLAB script to generate a plot containing two curves: Equations: Curve 1 : y = 1 / ( 1 + exp ( -
Write a MATLAB script to generate a plot containing two curves:
Equations:
Curve : y expa xLogistic function
Curve : y b xc Power Law function
Step by Step Solution
There are 3 Steps involved in it
Step: 1

Get Instant Access to Expert-Tailored Solutions
See step-by-step solutions with expert insights and AI powered tools for academic success
Step: 2

Step: 3
Ace Your Homework with AI
Get the answers you need in no time with our AI-driven, step-by-step assistance
Get Started
Oracle Autonomous Database In Enterprise Architecture
Authors: Bal Mukund Sharma, Krishnakumar KM, Rashmi Panda
1st Edition
1801072248, 978-1801072243