

Answered step by step
Verified Expert Solution
Question
1 Approved Answer
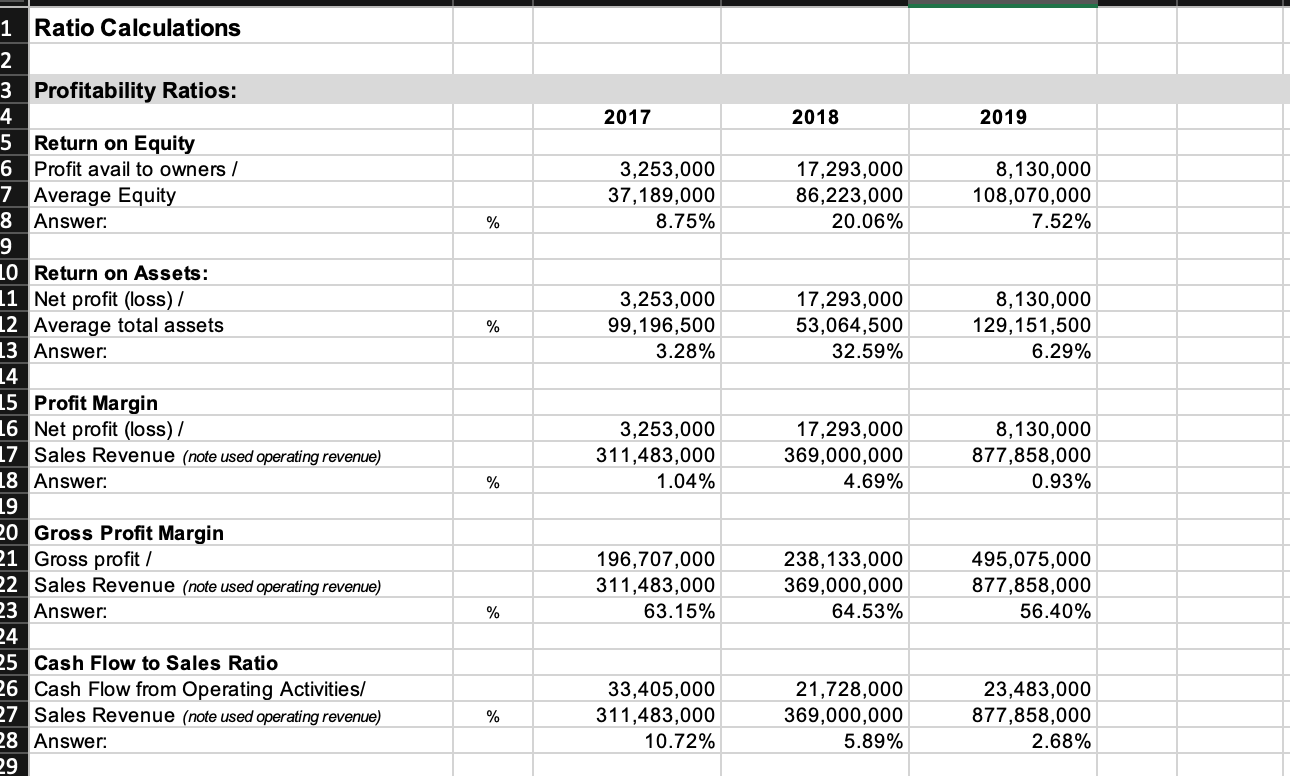
Write a probability analysis for this company 2017 2018 2019 3,253,000 37,189,000 8.75% 17,293,000 86,223,000 20.06% 8,130,000 108,070,000 7.52% % % 3,253,000 99,196,500 3.28% 17,293,000
Write a probability analysis for this company
Step by Step Solution
There are 3 Steps involved in it
Step: 1

Get Instant Access to Expert-Tailored Solutions
See step-by-step solutions with expert insights and AI powered tools for academic success
Step: 2

Step: 3
Ace Your Homework with AI
Get the answers you need in no time with our AI-driven, step-by-step assistance
Get Started
Principles of Accounting
Authors: Needles, Powers, crosson
11th Edition
1439037744, 978-1133626985, 978-1439037744