

Question: Write a program that uses a bar chart to display the percentages of the overall grade represented by project, exams, assignments, and the attendance, as
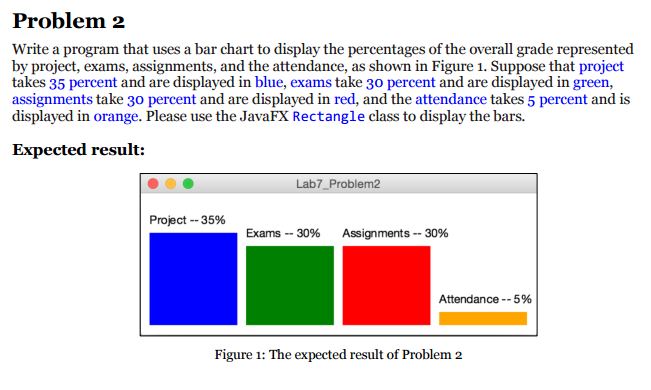
Write a program that uses a bar chart to display the percentages of the overall grade represented by project, exams, assignments, and the attendance, as shown in Figure l. Suppose that project takes 35 percent and are displayed in blue, exams take 30 percent and are displayed in green, assignments take 30 percent and are displayed in red, and the attendance takes 5 percent and is displayed in orange. Please use the JavaFX Rectangle class to display the bars
Step by Step Solution
There are 3 Steps involved in it
1 Expert Approved Answer
Step: 1 Unlock

Question Has Been Solved by an Expert!
Get step-by-step solutions from verified subject matter experts
Step: 2 Unlock
Step: 3 Unlock