

Question: package edu.wit.cs.comp1050; //TODO: document this class import javafx.application.Application; import javafx.geometry.Insets; import javafx.scene.Scene; import javafx.scene.layout.Pane; import javafx.scene.paint.Color; import javafx.scene.shape.Rectangle; import javafx.scene.text.Text; import javafx.stage.Stage; //TODO: document this
package edu.wit.cs.comp1050;
//TODO: document this class
import javafx.application.Application;
import javafx.geometry.Insets;
import javafx.scene.Scene;
import javafx.scene.layout.Pane;
import javafx.scene.paint.Color;
import javafx.scene.shape.Rectangle;
import javafx.scene.text.Text;
import javafx.stage.Stage;
//TODO: document this class
public class PA5b extends Application{
// TODO: write your code here
//Hint: You can use Text, Pane and Rectangle from JavaFX.
// You can hard code the height and paneHeight
@Override
public void start(Stage primaryStage) {
}
/**
* Put on a show
* @param args
*/
public static void main(String[] args) {
Application.launch(args);
}
}
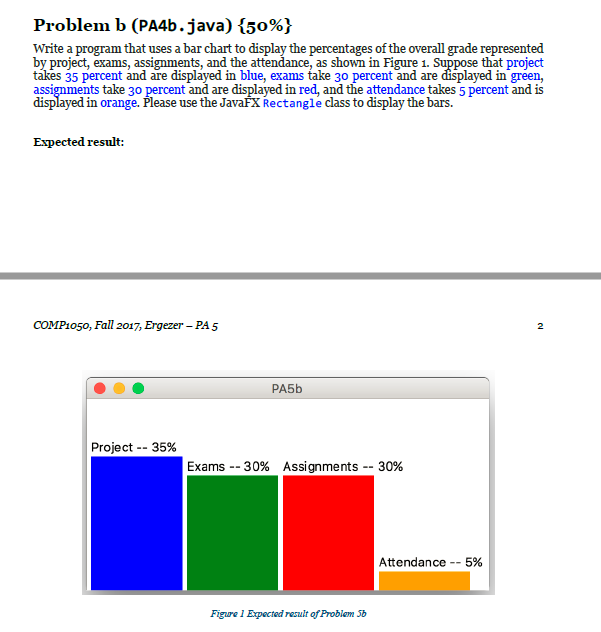
Problem b (PA4b.java)(50%) Write a program that uses a bar chart to display the percentages of the overall grade represented by project, exams, assignments, and the attendance, as shown in Figure 1. Suppose that project tkes 35 percent and are displyed in blue, exams take 30 percent and are displayed in green, assignments take 30 percent and are displayed in red, and the attendance takes 5 percent and is displayed in orange. Please use the JavafX Rectangle class to display the bars. Expected result: COMP1050, Fall 2017, Ergezer - PA5 2 Project-35% Exams-30% Assignments-30% Attendance-5% Figure 1 Expected result of Problem Sb
Step by Step Solution
There are 3 Steps involved in it

Get step-by-step solutions from verified subject matter experts