Write a report of your answers on separate sheets of paper, taking care to prepare a legible and organized report. Answer questions in order and underline or draw a box around any final numerical answers. Show your work for all answers and include the company name you obtained the data from. Full credit will not be given to answers without work, and partial credit may be given when work is shown. Write any written answers or explanations clearly, and be as neat as possible.
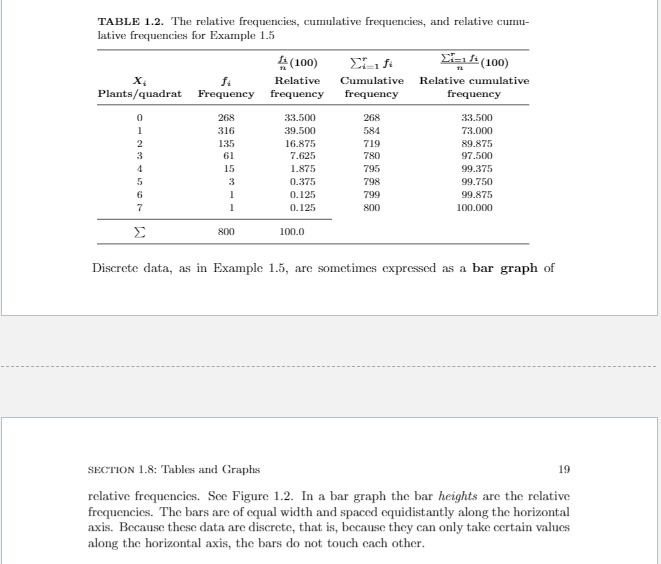
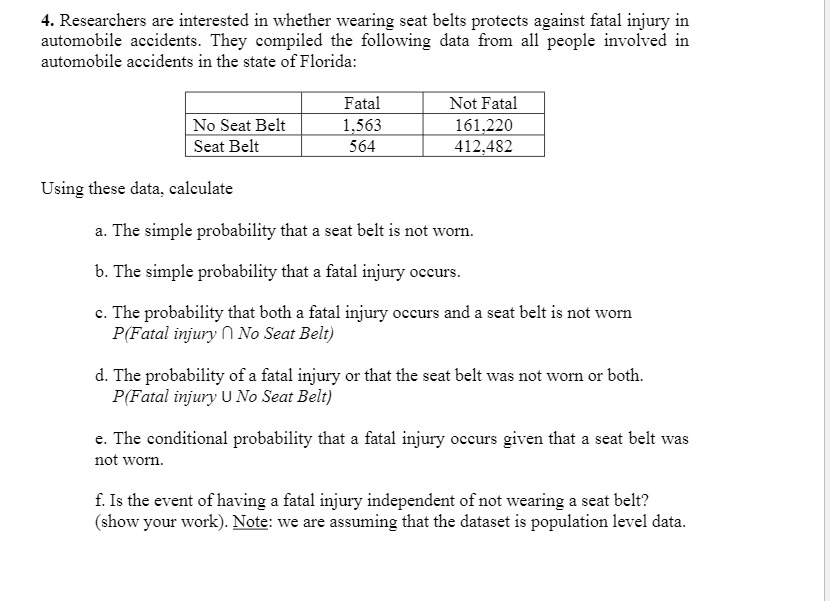
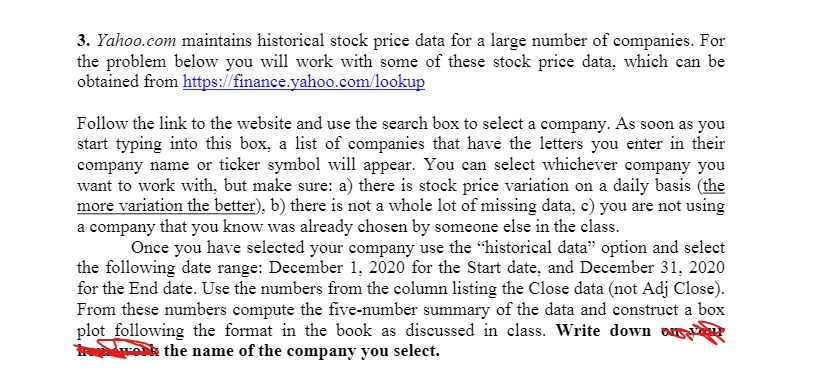
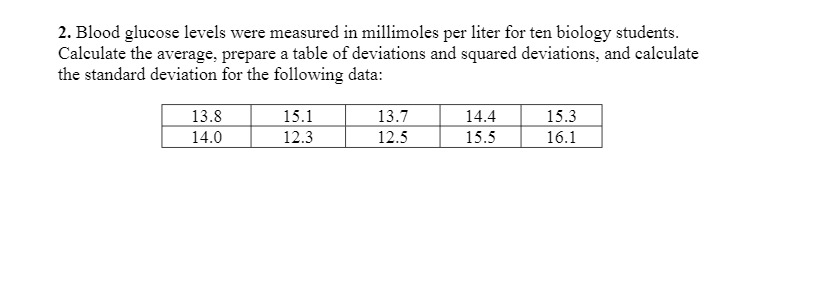
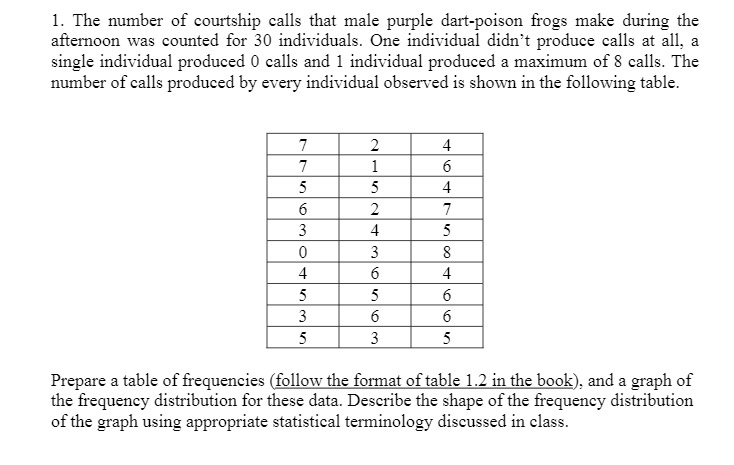
TABLE 1.2. The relative frequencies, cumulative frequencies, and relative cumu- lative frequencies for Example 1.5 (100) Zizi (100) f4 Relative Cumulative Relative cumulative Plants/quadrat Frequency frequency frequency frequency 268 33.500 268 33.500 316 39.500 584 73.000 135 16.875 719 89.875 61 7.625 780 97.500 15 1.875 795 99.375 0.375 798 99.750 0.125 799 99.875 0. 125 800 100.000 E 800 100.0 Discrete data, as in Example 1.5, are sometimes expressed as a bar graph of SECTION 1.8: Tables and Graphs 19 relative frequencies. See Figure 1.2. In a bar graph the bar heights are the relative frequencies. The bars are of equal width and spaced equidistantly along the horizontal axis. Because these data are discrete, that is, because they can only take certain values along the horizontal axis, the bars do not touch each other.4. Researchers are interested in whether wearing seat belts protects against fatal injury in automobile accidents. They compiled the following data om all people involved in automobile accidents in the state of Florida: Not Fatal No Seat Belt 1 563 161 220 Seat Belt 412,432 Using these data, calculate a. The simple probability that a seat belt is not worn. b. The simple probability that a fatal injury occurs. c. The probability that both a fatal injury occurs and a seat belt is not worn Pfiq'aral injury H No Seat Belt} {1. The probability of a fatal injury or that the seat belt was not worn or both. Pi'oroi injury U No Saar Belt] e. The conditional probability that a fatal injury occurs given that a seat belt was not worn. f. Is the event of having a fatal injury independent of not wearing a seat belt? {show your work). Note: we are assuming that the dataset is population level data. 3. Yahoorom maintains historical stock price data for a large number of companies. For the problem below you will work with some of these stock price data, which can be obtained from httpstfffmanceyahoocomflookup Follow the link to the website and use the search box to select a company. As soon as you start typing into this box, a list of companies that have the letters you enter in their company name or ticker symbol will appear. You can select whichever company you want to work with, but make sure: a) there is stock price variation on a daily basis {g more variation the better}, b) there is not a whole lot of missing data, c} you are not using a company that you know was already chosen by someone else in the class. Once you have selected your company use the \"historical data\" option and select the following date range: December 1_. 2020 for the Start date, and December 3], 2020 for the End date. Use the numbers from the column listing the Close data (not Adj Close). From these numbers compute the five-number summary of the data and construct a box plot following the format in the book as discussed in class. Write down W m the name of the company you select. 2. Blood glucose levels were measured in millimoles per liter for ten biology students. Calculate the average, prepare a table of deviations and squared deviations, and calculate the standard deviation for the following data: 1. The number of courtship calls that male purple dart-poison frogs make during the afternoon was counted for 30 individuals. One individual didn't produce calls at all, a single individual produced 0 calls and 1 individual produced a maximum of 8 calls. The number of calls produced by every individual observed is shown in the following table. 2 + 1 -J 6 u a ofout 6 3 Prepare a table of frequencies (follow the format of table 1.2 in the book), and a graph of the frequency distribution for these data. Describe the shape of the frequency distribution of the graph using appropriate statistical terminology discussed in class