Write a script in Matlab Your task is to write a Matlab script that creates graphs for the components of velocity and acceleration of points P and G from Figure 2 for three rotations of the disk. Your code should be written for the general case of constant angular velocity using variables r, , and . It should plot the following graphs:
1. Y position of P vs X position of P
2. X component of velocity at P vs X position of P
3. Y component of velocity at P vs X position of P
4. X component of acceleration at P vs X position of P
5. Y component of acceleration at P vs X position of P
6. X component of velocity at G vs X position of P
7. Y component of velocity at G vs X position of P
8. X component of acceleration at G vs X position of P
9. Y component of acceleration at G vs X position of P
For the purposes of this exercise, show plots for when r=1 m, =1 / and =0 /8. Display the graphs so that they can be easily compared (hint: consider using the subplot function). Be sure to label your axes.
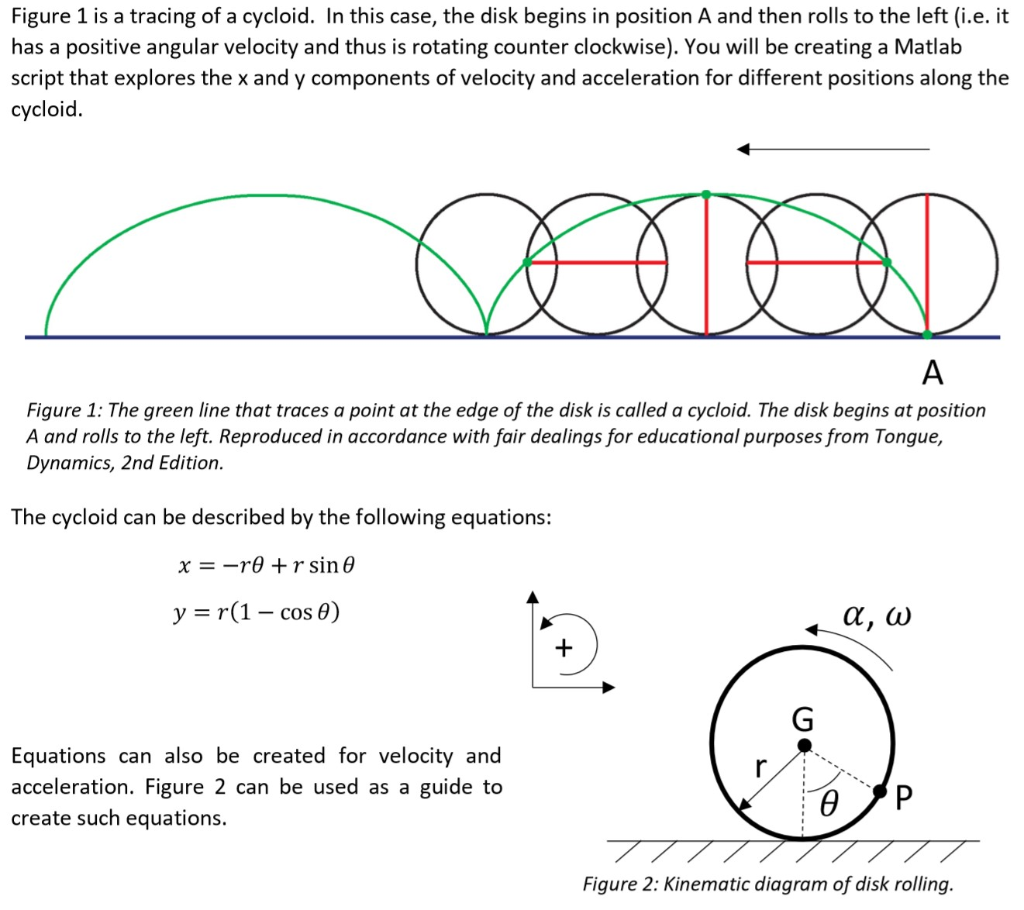
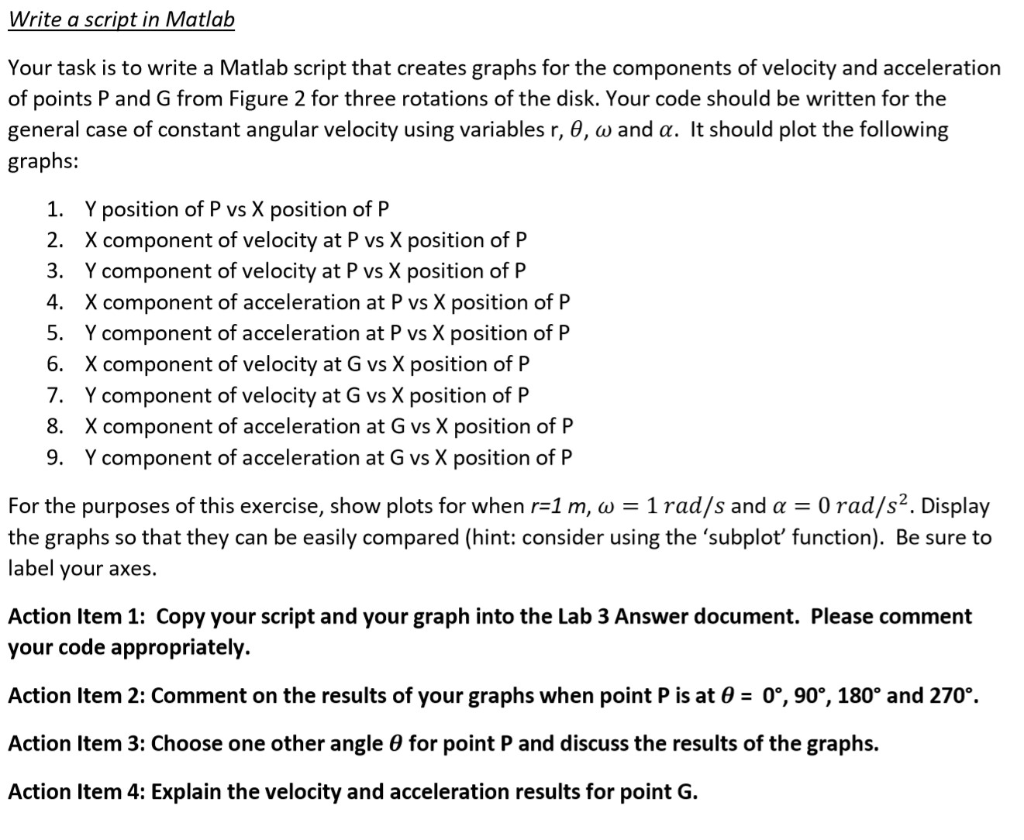
Figure 1 is a tracing of a cycloid. In this case, the disk begins in position A and then rolls to the left (i.e.it has a positive angular velocity and thus is rotating counter clockwise). You will be creating a Matlab script that explores the x and y components of velocity and acceleration for different positions along the cycloid. Figure 1: The green line that traces a point at the edge of the disk is called a cycloid. The disk begins at position A and rolls to the left. Reproduced in accordance with fair dealings for educational purposes from Tongue, Dynamics, 2nd Edition. The cycloid can be described by the following equations: x = -re + r sin y=r(1 cos ) aa, w Equations can also be created for velocity and acceleration. Figure 2 can be used as a guide to create such equations. Figure 2: Kinematic diagram of disk rolling. Write a script in Matlab Your task is to write a Matlab script that creates graphs for the components of velocity and acceleration of points P and G from Figure 2 for three rotations of the disk. Your code should be written for the general case of constant angular velocity using variables r, 0, w and a. It should plot the following graphs: 1. Y position of P vs X position of P 2. X component of velocity at P vs X position of P 3. Y component of velocity at P vs X position of P 4. X component of acceleration at P vs X position of P 5. Y component of acceleration at P vs X position of P 6. X component of velocity at G vs X position of P 7. Y component of velocity at G vs X position of P 8. X component of acceleration at G vs X position of P 9. Y component of acceleration at G vs X position of P For the purposes of this exercise, show plots for when r=1 m, w = 1 rad/s and a = 0 rad/s2. Display the graphs so that they can be easily compared (hint: consider using the 'subplot' function). Be sure to label your axes. Action Item 1: Copy your script and your graph into the Lab 3 Answer document. Please comment your code appropriately. Action Item 2: Comment on the results of your graphs when point P is at 0 = 0, 90, 180 and 270. Action Item 3: Choose one other angle 0 for point P and discuss the results of the graphs. Action Item 4: Explain the velocity and acceleration results for point G. Figure 1 is a tracing of a cycloid. In this case, the disk begins in position A and then rolls to the left (i.e.it has a positive angular velocity and thus is rotating counter clockwise). You will be creating a Matlab script that explores the x and y components of velocity and acceleration for different positions along the cycloid. Figure 1: The green line that traces a point at the edge of the disk is called a cycloid. The disk begins at position A and rolls to the left. Reproduced in accordance with fair dealings for educational purposes from Tongue, Dynamics, 2nd Edition. The cycloid can be described by the following equations: x = -re + r sin y=r(1 cos ) aa, w Equations can also be created for velocity and acceleration. Figure 2 can be used as a guide to create such equations. Figure 2: Kinematic diagram of disk rolling. Write a script in Matlab Your task is to write a Matlab script that creates graphs for the components of velocity and acceleration of points P and G from Figure 2 for three rotations of the disk. Your code should be written for the general case of constant angular velocity using variables r, 0, w and a. It should plot the following graphs: 1. Y position of P vs X position of P 2. X component of velocity at P vs X position of P 3. Y component of velocity at P vs X position of P 4. X component of acceleration at P vs X position of P 5. Y component of acceleration at P vs X position of P 6. X component of velocity at G vs X position of P 7. Y component of velocity at G vs X position of P 8. X component of acceleration at G vs X position of P 9. Y component of acceleration at G vs X position of P For the purposes of this exercise, show plots for when r=1 m, w = 1 rad/s and a = 0 rad/s2. Display the graphs so that they can be easily compared (hint: consider using the 'subplot' function). Be sure to label your axes. Action Item 1: Copy your script and your graph into the Lab 3 Answer document. Please comment your code appropriately. Action Item 2: Comment on the results of your graphs when point P is at 0 = 0, 90, 180 and 270. Action Item 3: Choose one other angle 0 for point P and discuss the results of the graphs. Action Item 4: Explain the velocity and acceleration results for point G