

Question: WRITE A SUMMARY OF THE ARTICLE BELOW a written summary 259 Case 17 The Boeing 7E? to have raised serious concerns regarding the cost of
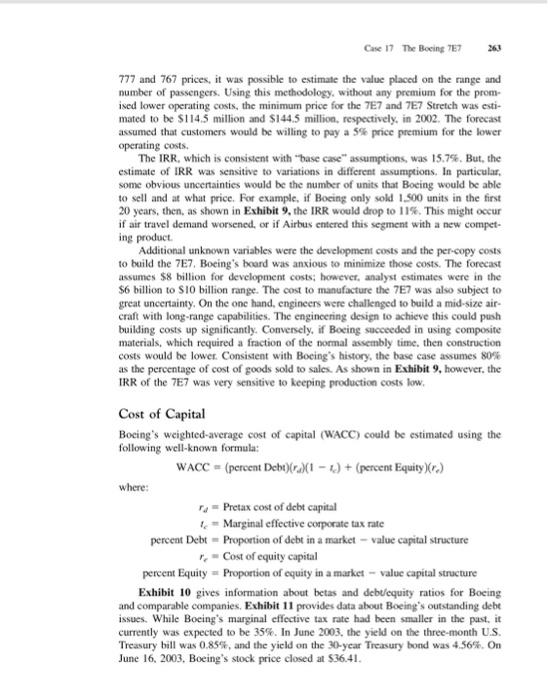
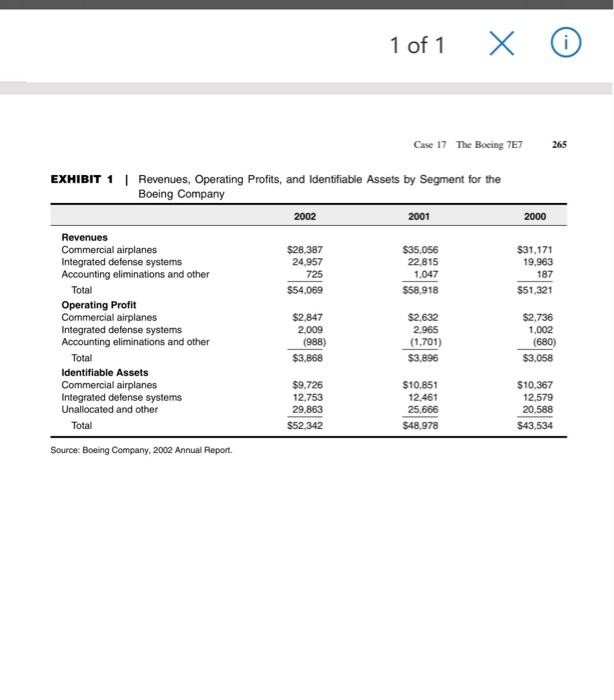
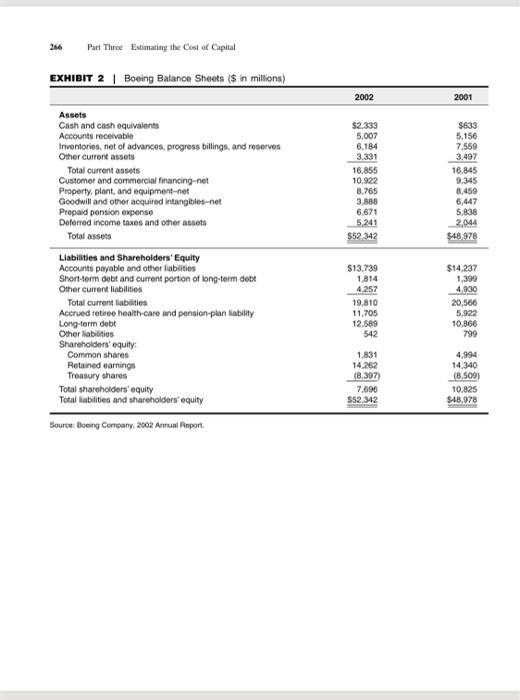
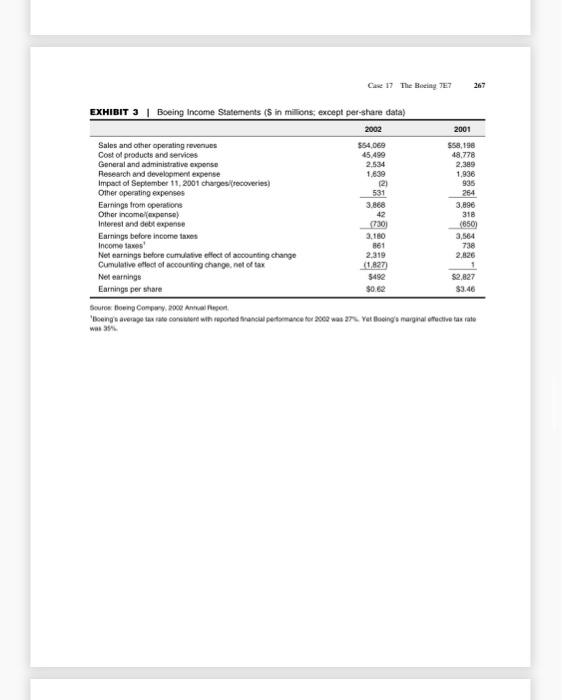
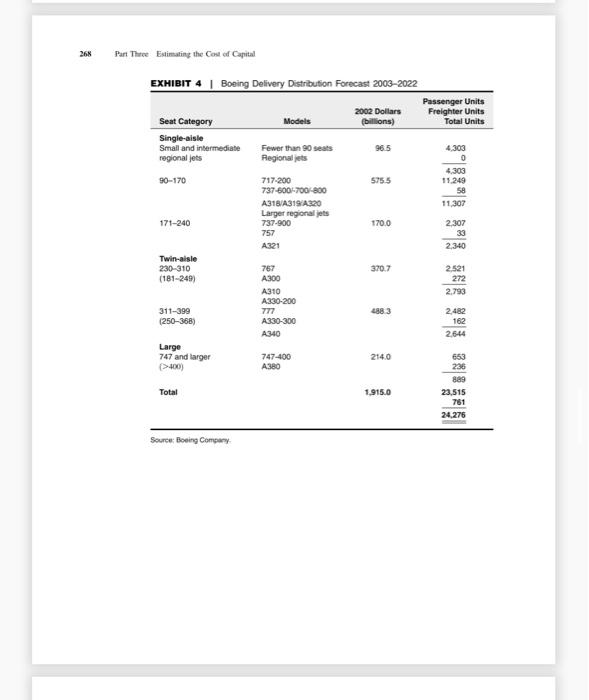
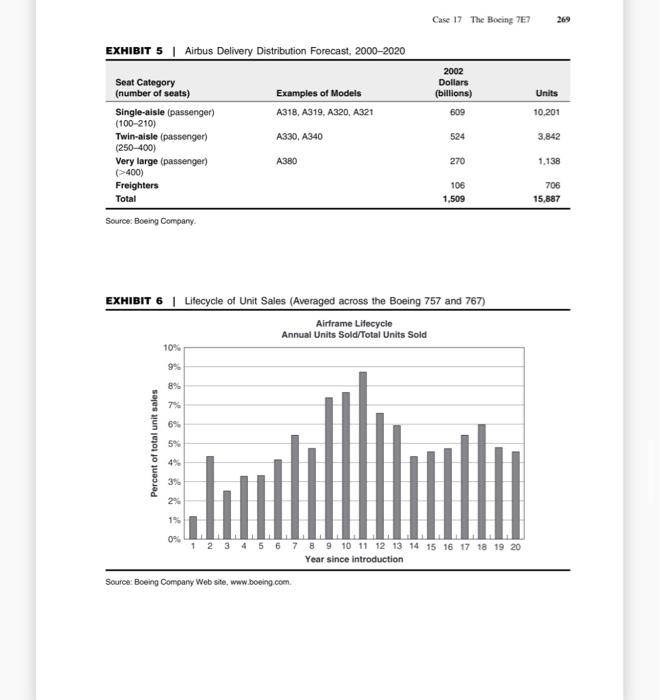
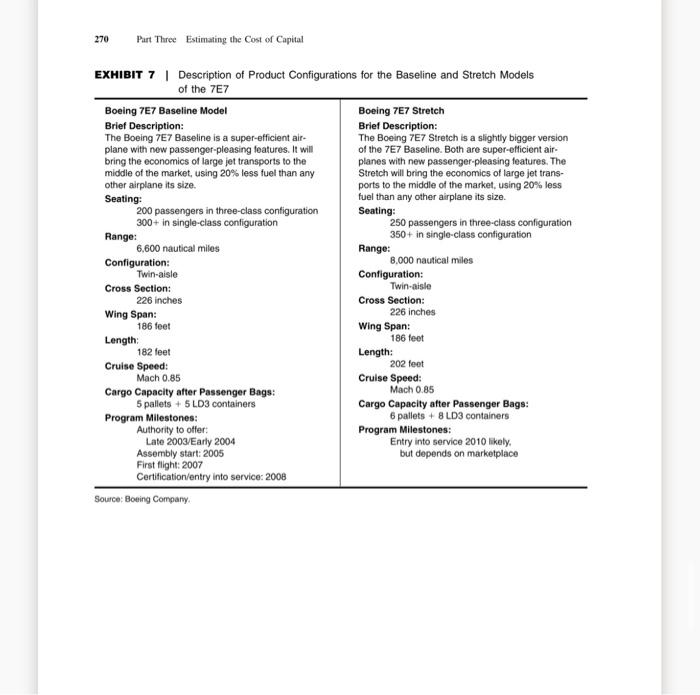
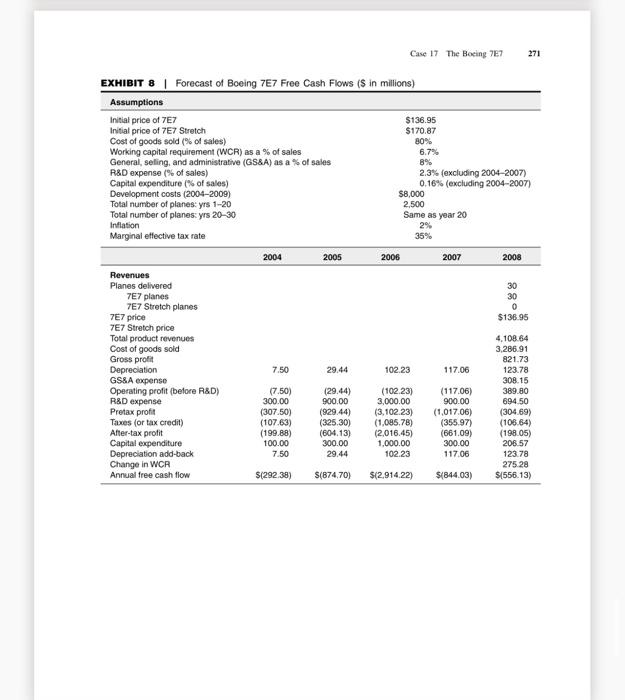
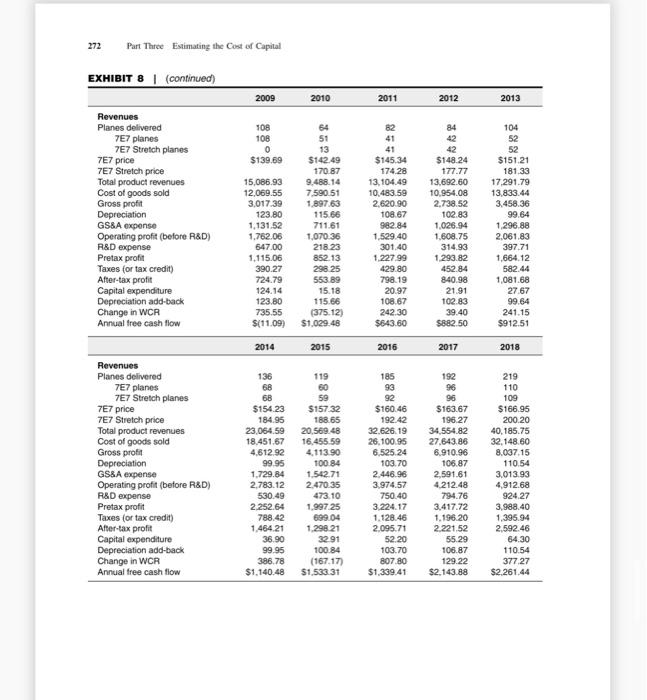
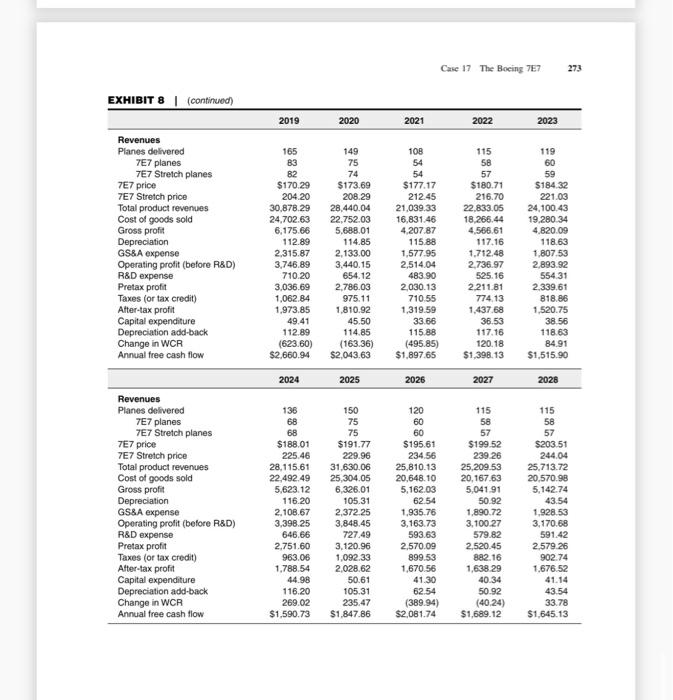
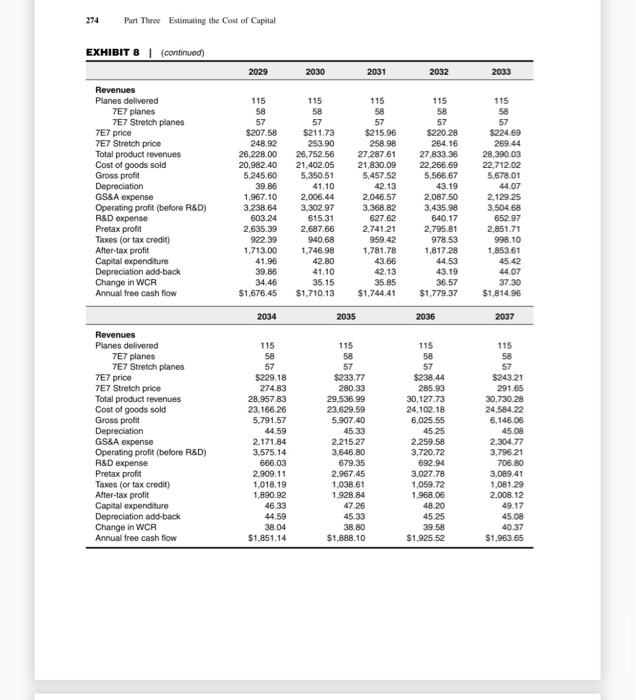
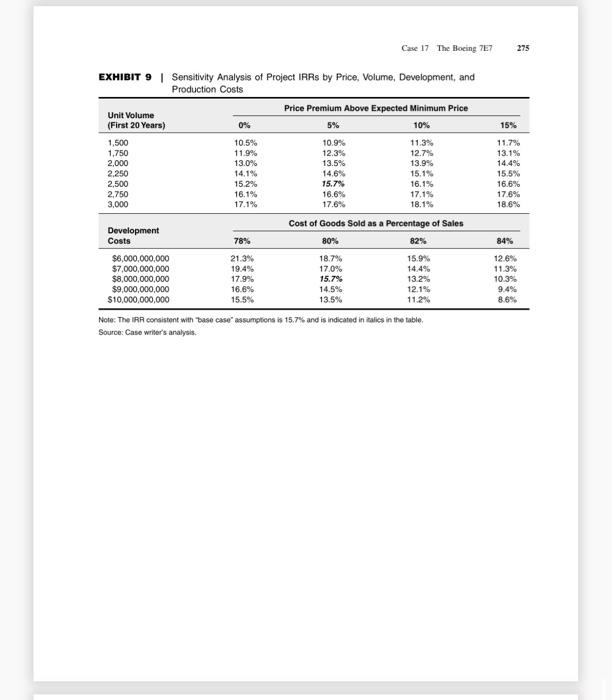
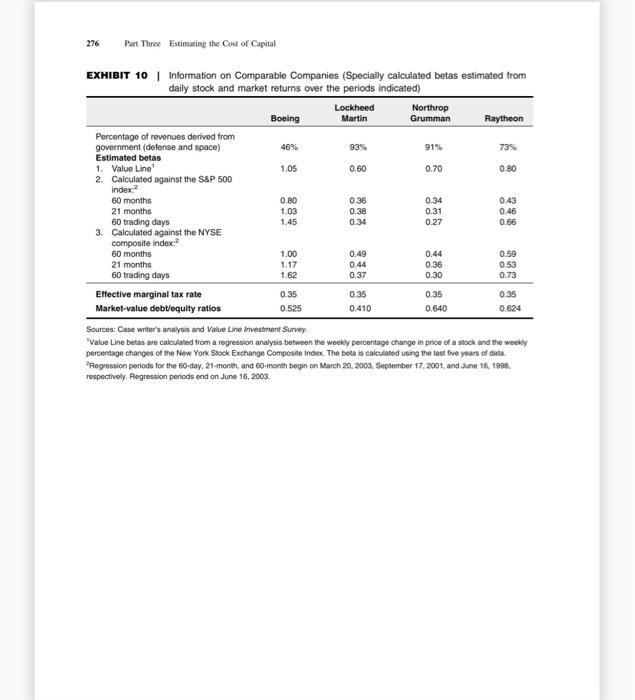
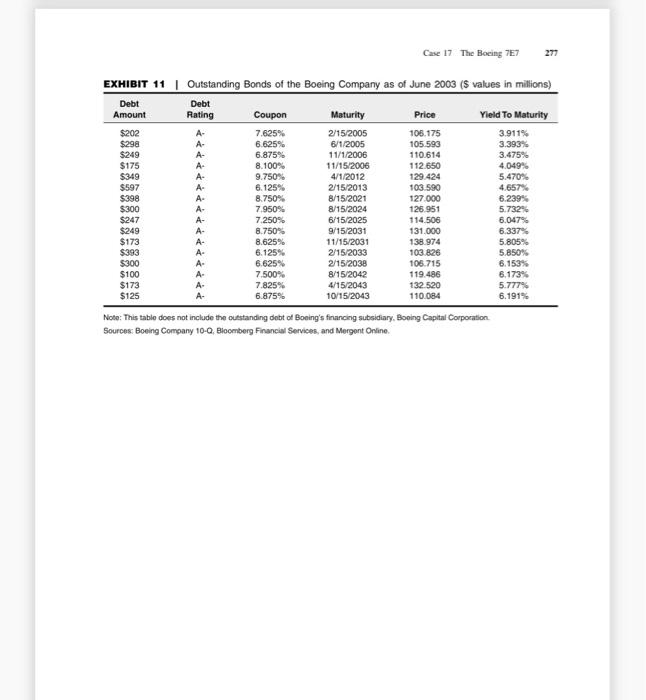
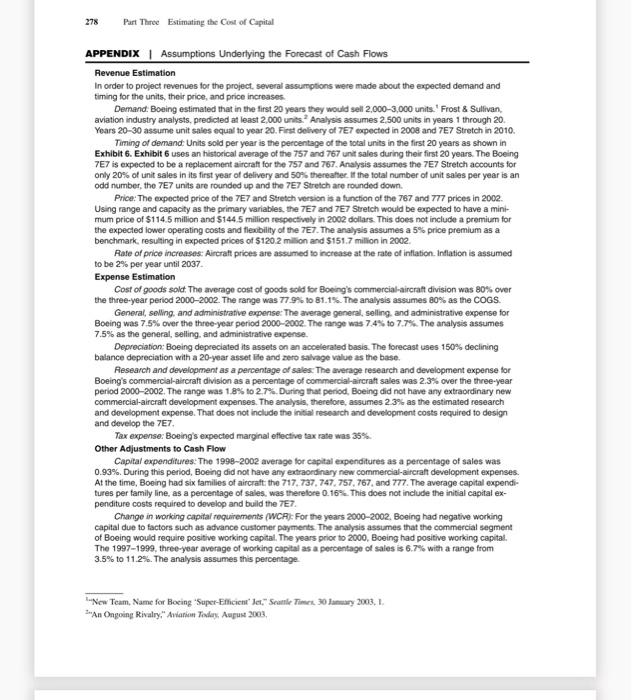
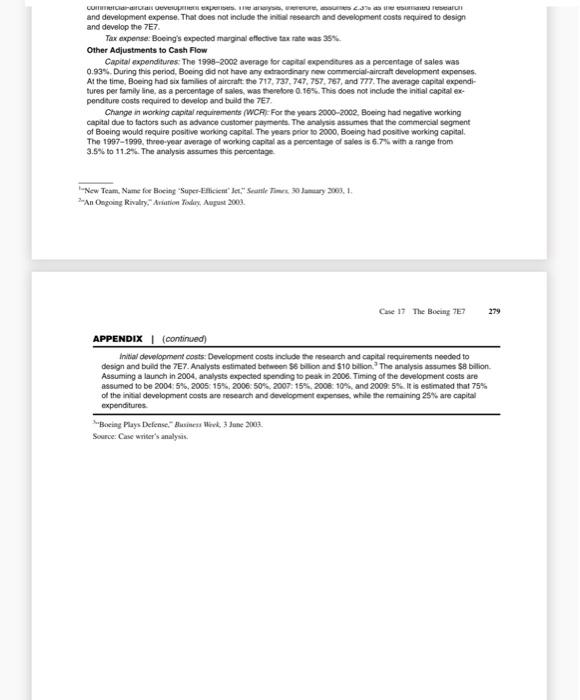
259 Case 17 The Boeing 7E? to have raised serious concerns regarding the cost of the 7E7. While the cost of devel- oping the 7E7 project could be as high as $10 billion, there was an imminent veto threat if that number did not shrink by billions. More specifically the board wanted to keep 7E7 development costs down to only 40% of what it took to develop the 777. An additional pressure from the board was to keep the 7E7 per-copy costs to only 60% of the 777 costs. In response, Philip Condit, Boeing's CEO and chair, was quoted as saying that "Boeing has a responsibility to develop jetliners for less. He knew, however, that if Boeing did not take bold risks in the commercial-aircraft industry that their days as a serious competitor to Airbus were numbered. Commercial-Aircraft Industry In 2002, two companies, Boeing and Airbus, dominated the large plane (100+ seats) commercial-aircraft industry. While Boeing historically held the lead in this market. through a number of measures Airbus became number one. In 2002. Airtus received 233 commercial orders compared to Bocing's 176 orders, representing a 575 unit market share and an estimated 535 dollar value market share. Airbus Industry Airbus was understandably proud of its growth. Established in 1970, by a consortium of European companies, it took Airbus 23 years to deliver its first 1000 aircrafts, another six years to deliver the next 1000, and only another three years (by 2002) to pass the 3000 aircraft milestone. In 1999, for the first time in its history. Airbus recorded more plane orders than its rival, Bocing Airbus's large plane commercial-aircraft products included the A300/310, A320 A330/340, and A380 families. Airbus touted the A300310 family as having the flexibility to serve short-, medium- and extended-range routes. The widebody. twin-engine aircraft was considered mid-size, with a typical passenger configuration of about 250 passengers. This family first flew passengers in 1983, and it was this aging flect that provided a replacement opportunity for Boeing's 7E7. However, while Boeing was betting on the future demand for mid-size aircraft. Airbus announced its A380, superjumbo four-engine jet in 2000. The A380 was due to fly in 2006 with a 550-passenger configuration and long distance range of up to 8000 miles. It would be the largest passenger aircraft ever built. The Boeing Company Boeing was split into two primary segments commercial airplanes and integrated defense systems. In 2002. it was awarded 516.6 billion in defense contracts, second "Losing Groud to Aistus, Boeing Faces a Key Choice." Wal Street Journat. 21 April 2003 2002 Commercial Results" wwwirbes.com In 2001. Airtes formally became a single integrated entity through the transfer of Airbus latelsets to the newly incorporated company. European Aerotic Defense and Space Company (EADS) owned 807 of the new company, and BAE systems owned the remaining 205. 260 Pan Thee Estimating the Cost of Capital only to Lockheed Martin with $17.0 billion. Exhibit 1 shows that in 2002. cach seg. ment earned Boeing's revenues almost equally. In addition, while commercial-aircraft revenues had been falling, defense revenues had been rising. Analysts believed that Boeing was able to transfer significant amounts of technology from the defense R&D to the commercial-aircraft segment. The commercial-aircraft segment produced and sold six main airframes designed to meet the needs of the shon- to long-range markets: the 717.737, and 757 standard- body models and the 747, 767, and 777 wide-body models. As of December 31, 2002, Boeing undelivered units under firm order of 1083 commercial aircraft and had a declining hacklog of about $68 billion. For 2003, it projected 280 commercial-aircraft deliveries and expected between 275 and 300 in 2004. Boeing estimated that in 2003, the revenues for its commercial-airplane segment would be approximately 522 billion, down from $28 billion in 2002. Recognizing the negative impact of the September 11th attacks on commercial-aircraft demand, Boeing cut the production rates for 2002 in half in order to maintain profitability in that segment. Exhibits 2 and 3 show Boeing's balance sheet and income statement respectively, While Boeing's earnings were down significantly from 2001 to 2002, most of this was the result of an accounting change (SFAS No. 142). However, a drop in commercial- airplane deliveries from 527 in 2001 to 381 in 2002 also contributed to the decline. Demand for Commercial Aircraft The long-term outlook for aircraft demand seemed positive. Boeing's Market Out- look said the following: In the short term, air travel is influenced by business cycles.consumer confidence, and exogenous events. Over the long-term, cycles smooth out, and GDP, international trade, lower fares, and network service impeovements become paramount. During the next 20 years, economies will grow annually by 3.25and air travel will continue its historic relationship with GDP by growing at an average annual rate of 5.1%. As shown in Exhibit 4, Boeing's 20-year forecast from 2003 to 2022, was for 24.276 new commercial aircraft in 2002, valued at $1.9 trillion. The company predicted a composition of 4.303 smaller regional jets (fewer than 90 seats): 13,647 single-aisle airplanes: 5.437 intermediate twin-aisle airplanes and 889 747-size or larger airplanes. This prediction reflected a world fleet that would more than double, with one-fourth of the market coming from aircraft replacement and three-fourths from projected pas- senger and cargo growth Exhibit 5 illustrates Airbus's 20-year predictions for the years 2000-2020, Although the report was dated 2002, because of the September 11 attacks, numbers included the year 2000, to serve as a benchmark year. For that period, Airbus predicted The primary sources for commercial aircraft demand estimates include Boeing's 2003 Current Marker Outlook and Airbus's 2002 Global Market Forecase 2001-2020. While boch reports recognized the negative effects of exogenous events such as September 11, 2001, they both agreed on a healthy long-term outlook. 251 Case 17 The Bacing TEZ the delivery of 15,887 new commercial aircraft in 2002. with a value of (U.S. dollars) $1.5 trillion. This included 10.201 single-aske aircraft: 3,842 twin-aisle aircraft: 1.138 very large aircraft, and 706 freighters. The 15,887-unit forecast did not include planes with less than 90 seats. Although Bocing and Airbus's numbers are not directly comparable due to the slightly different time periods and aircraft classifications, it appeared that Airbus was more optimistic about the market for large aircraft than Boeing was. While Airbus predicted it to be a $270 billion market, including 1138 passenger units, Boeing pro- jected only $214 billion with 653 passenger units. Boeing, however, estimated that the share of intermediate-size planes would increase from 18 to 229. In its fore cast, Boeing acknowledged that intermediate-size airplanes would economically allow airlines to fly the increased frequencies, city pairs, and nonstop flights requested by passengers. According to a recent study by Frost & Sullivan, they believed that the Airbus market projection for the A380 was over-optimistic.*** Aircraft Development and Lifecycle The development of a new airframe was characterized by huge initial cash outflows that might require between one and two decades to recoup. For example, the devel- opment costs for the Boeing 777 were rumored to be 57 billion. Any pricing would not only have to recoup the upfront development costs but also the production costs. In addition, pricing would be subject to rigorous, competitive pressures. In short, because of the financial strains a new product line might create, each new aircraft was a "bet the ranch" proposition. Over time, survival in the industry depended on intro- ducing successful products and having the deep financial pockets with which to sur- vive the initially gushing cash flow. While aircraft sales were subject to short-term. cyclical deviations, there was some degree of predictability in sales . Sales would typically peak shortly after the introduction of the new aircraft, and then fall. Thereafter, sales would rise and fall as derivatives of the aircraft wete offered. Exhibit 6 shows the cycles for the first 20 years of the 757 and 767 sales. The 7E7 The concept of the Boeing 7E7 was driven by customer requirements. Boeing onginally announced in March 2001, its plans to build the Sonic Cruiser, a plane that would fly just below the speed of sound. The success of the Cruiser depended on whether pas- sengers would pay a premium for a faster flight. However, potential airplane customers who had been interested in the Cruiser during a robust, commercial-air travel market were now focusing on survival. The events of September 11 and the bursting of the technology bubble led to a significant decline in airplane orders. As a result. Boeing solicited updated feedback from a number of potential customers who would soon need An Ongoing Rivalry." Anionica TecayAugust 2003 262 Part Three Estimating the cost of Capital to replace their aging fleet of mid-range planes, such as the 7575, 7675, A300, A310S. A321s, and A330, Overwhelmingly, the revised message from customers was for a plane with lower operating costs. Based on discussions with over 40 airlines throughout the world, Bair identified a fresh market to replace mid-size planes, based not only on lower operating costs, but also on the creation of a mid-size plane that could travel long distances, a feat previously viable by only large planes, such as the 747. Such flexibility would allow airlines to offer nonstop service on routes that required long-range planes but did not justify the subsequent larger size. Bair estimated there to be more than 400 city pairs (e.g.. Atlanta-Athens) that could be served efficiently on a nonstop basis by the 7E7. Boeing was considering two new members for the 7E7 family, a basic and a stretch version. Exhibit 7 gives Boeing's description of the two configurations. Other improvements for passengers included wider aisles, lower cabin altitude, and increased cabin humidity. In addition, the planes would include systems that provided in-flight entertainment, Internet access, real-time airplane systems and structure health moni- toring, and crew connectivity. Furthermore, Boeing claimed the 7E7 would have the smallest sound "footprint" with the quietest takeoff and landing in its class Boeing projected a demand for between 2000 and 3000 planes of the 7E7 type within 20 years of each one entering service. A study by Frost & Sullivan predicted the sale of at least 2000 B7E7s." However, the demand was highly dependent on whether Boeing could deliver the promised 20% cheaper fuel costs and the range flex- ibility in a mid-size aircraft. Furthermore, if the range flexibility did require snap-on wings, such a design may significantly increase the building costs of the aircraft. Not only did Boeing face the engineering uncertainty of being able to deliver such an air- craft . but also the risk of its duplication by Airbus. Airbus had already stated that if the fuel efficiency was primarily generated by new engine designs, then it would sim- ply order the more efficient engines for its planes. Any uncertainty in the 7E7 plane specifications and risk of competition clearly put downward pressure on both the price Boeing could demand, as well as the number of units it would be able to sell. Financial Forecast and Analysis Exhibit 8 contains a 20-year forecast of free cash flows from the Boeing 7E7 project consistent with public information released by Boeing, Airbus, analysts, and other experts in the field. See the Appendix for detailed forecast assumptions. The primary implication of the forecast is that the 7E7 project would provide an internal rate of retum (IRR) close to 16%. This assumes that Boeing would not only deliver the promised plane specifications, but that Airbus would be unable to replicate the 7E7 efficiencies. Based on both analysts and Boeing's expectations, the base case assumes that Boeing could sell 2500 units in the first 20 years of delivery. Pricing was estimated using 2002 prices for Boeing's 777 and 767. The 7E7 would be a hybrid of the two planes in terms of the number of passengers and range. By interpolating between the An Onning Rivalry 263 Case 17 The Boeing 767 777 and 767 prices, it was possible to estimate the value placed on the range and number of passengers. Using this methodology, without any premium for the prom- ised lower operating costs, the minimum price for the 7E7 and 7E7 Stretch was esti- mated to be $114.5 million and $144.5 million, respectively, in 2002. The forecast assumed that customers would be willing to pay a 5% price premium for the lower operating costs. The IRR, which is consistent with "base case assumptions, was 15.7%. But, the estimate of IRR was sensitive to variations in different assumptions. In particular, some obvious uncertainties would be the number of units that Boeing would be able to sell and at what price. For example, if Boeing only sold 1.500 units in the first 20 years, then, as shown in Exhibit 9, the IRR would drop to 11%. This might occur if air travel demand worsened, or if Airbus entered this segment with a new compet- ing product Additional unknown variables were the development costs and the per-copy costs to build the 7E7, Boeing's board was anxious to minimize those costs. The forecast assumes $8 billion for development costs; however, analyst estimates were in the $6 billion to S10 billion range. The cost to manufacture the 7E7 was also subject to great uncertainty. On the one hand, engineers were challenged to build a mid-size air- craft with long-range capabilities. The engineering design to achieve this could push building costs up significantly. Conversely, if Boeing succeeded in using composite materials, which required a fraction of the normal assembly time, then construction costs would be lower. Consistent with Boeing's history, the base case assumes 80% as the percentage of cost of goods sold to sales. As shown in Exhibit 9, however, the IRR of the 7E7 was very sensitive to keeping production costs low Cost of Capital Boeing's weighted average cost of capital (WACC) could be estimated using the following well-known formula: WACC = (percent Debt)(X - 1.) + (percent Equity)(a) where: = Pretax cost of debt capital 1 = Marginal effective corporate tax rate percent Debt - Proportion of debt in a market - value capital structure - Cost of equity capital percent Equity Proportion of equity in a market - value capital structure Exhibit 10 gives information about betas and debt/equity ratios for Boeing and comparable companies. Exhibit 11 provides data about Boeings outstanding debe issues. While Boeing's marginal effective tax rate had been smaller in the past, it currently was expected to be 35%. In June 2003, the yield on the three-month US. Treasury bill was 0.85%, and the yield on the 30-year Treasury bond was 4.56%. On June 16, 2003. Boeing's stock price closed at $36.41. 264 Part Three Estimating the Cost of Capital Analysts pointed out that Boeing actually consisted of two separate businesses: the relatively more stable defense business and the conversely more volatile com- mercial business. Defense corporations were the beneficiaries when the world became unstable due to the terrorist attacks on September 11, 2001. Furthermore, the United States, along with some of its allies, went to war against Iraq on March 20, 2003. While Bush declared an end to major Iraqi combat operations on May 1, 2003, as of June 16, the death toll in Iraq continued to rise on a daily basis. A different type of risk emanated with the outbreak of SARS. On February 1, 2003. China announced the discovery of the deadly and contagious illness that subsequently spread to Canada and Australia. As of June 16, travel warnings were still outstanding. Thus, the question arose of whether one should estimate Boeing's cost of capital to serve as a benchmark- required rate of return. Would a required return on a portfolio of those two businesses be appropriate for evaluating the 7E7 project? If necessary, how might it be possible to isolate a required return for commercial aircraft? Conclusion Within the aircraft-manufacturing industry, the magnitude of risk posed by the launch- ing of a major new aircraft was accepted as a matter of course. With huge, upfront, capital costs in an environment of intense technology and price competition, there was no guarantee of success or major significant losses if the gamble did not pay off. At a time of great political and economic uncertainty, Michael Bair said: Clearly, we have to make a compelling business proposition. It could be [that] we'll still be in a terrible business climate in 2004. But you can't let what's happening today cause you to make bad decisions for this very long business cycle. This plane is very important to our future." Central to any recommendation that Bair would make to Boeing's board of direc- tors was an assessment of the economic profitability of the 7E7 project. Would the project compensate the shareholders of Boeing for the risks and use of their capital? Were there other considerations that might mitigate the economic analysis? For instance, to what extent might organizational and strategic considerations influence the board? If Boeing did not undertake the 7E7, would it be conceding leadership of the commercial-aircraft business to Airbus? New Team, Name for Boeing 'Super-Efficient" Jet." Seanle Times, 30 January 2003 1 of 1 i Case 17 The Boeing 7E7 265 2000 $31,171 19.963 187 $51,321 EXHIBIT 1 Revenues, Operating Profits, and Identifiable Assets by Segment for the Boeing Company 2002 2001 Revenues Commercial airplanes $28,387 $35,056 Integrated defense systems 24,957 22.815 Accounting eliminations and other 725 1.047 Total $54.069 $58,918 Operating Profit Commercial airplanes $2.847 $2.632 Integrated defense systems 2,009 2,965 Accounting eliminations and other (988) (1.701) Total $3,868 $3,896 Identifiable Assets Commercial airplanes $9.726 $10,851 Integrated defense systems 12.753 12.461 Unallocated and other 29,863 25,666 Total $52,342 $48.978 Source: Boeing Company, 2002 Annual Report $2.736 1,002 (680) $3,058 $10,367 12.579 20.588 $43.534 266 Part Three Estimating the cost of Capital EXHIBIT 2 | Boeing Balance Sheets ($ in millions) 2002 2001 $2,333 5,007 6.184 3.331 Assets Cash and cash equivalents Accounts receivable Inventories, net of advancos, progress billings, and reserves Other current assets Total current assets Customer and commercial financing-net Property, plant, and equipment-net Goodwill and other acquired intangibles.net Prepaid pension expense Deferred income taxes and other assets Total assets 16,855 10,922 8.765 3.888 6,671 5.241 $52 342 $633 5,156 7.559 3.497 16.845 9.345 8,459 6,447 5,838 2,044 $48.978 $13.739 1.814 4257 19,810 11.705 12.589 542 $14.237 1.399 4,930 20,566 5,922 10.866 799 Liabilities and Shareholders' Equity Accounts payable and other labities Short-term debt and current portion of long-term dett Other current liabilities Total current abilities Accrued retiree health-care and pension-plan kabilly Long-term debt Other liabilities Shareholders' equity Common shares Retained earnings Treasury shares Total shareholders equity Total abilities and shareholders' equity Source: Boeing Company, 2002 Annual Report 1,831 14 262 (8,397) 7.698 $52,342 4,994 14,340 (8.509) 10,825 $48.978 Case 17 The Boeing 7E7 267 EXHIBIT 3 | Boeing Income Statements (5 in mions, except per stare data) 2002 2001 Sales and other operating revenues 554.069 558,198 Cost of products and services 45.490 48,778 General and administrative expense 2.534 2.389 Research and development expense 1.639 1,936 Impact of September 11, 2001 charges (recoveries) 21 935 Other operating expenses 531 264 Earnings from operations 3.868 3.898 Other income expense 42 318 Interest and debt expense 730 (650) Earnings before income taxes 3.100 3,564 Income taxes 361 738 Net earnings before cumulative effect of counting change 2,319 2,826 Cumulative effect of accounting change, net of tax 1.827 Net earnings 3492 $2.827 Earnings per share $0.62 $3.46 Souto toong Company, 2000 Antal en Woeng average tax rate carattert with uponed francul performance tur 2002 was 271 Yet lacind'o marginal active tax rato 26 Part Three Estimating the Cost of Capital EXHIBIT 4 | Boeing Delivery Distribution Forecast 2003-2022 Passenger Units 2002 Dollars Freighter Units Seat Category Models (billions) Total Units Single-aisle Small and intermediate Fewer than 90 seats 96.5 4,303 regional Jets Regionales 0 4,303 90-170 717-200 5755 11.249 737-800-700-800 58 A318/A319 A320 11.307 Larger regional jets 171-240 737-900 170.0 2.307 757 33 A321 2,340 Twin-aisle 230-310 767 370.7 2.521 (181-249) A300 272 A310 2.793 A330-200 311-399 4883 2.482 (250-368) A330-300 162 A340 2,644 Large 747 and larger 747-400 214.0 653 >400) A380 236 889 Total 1.915.0 23,515 781 24.276 Source: Boeing Company Case 17 The Boeing 77 269 EXHIBIT 5 Airbus Delivery Distribution Forecast, 2000-2020 2002 Dollars (billions) 609 Examples of Models A318, A319, A320, A321 A330, A340 Seat Category (number of seats) Single-aisle (passenger) (100-210) Twin-aisle (passenger (250-400) Very large (passenger) (>400) Freighters Total Units 10,201 524 3,842 A380 270 1.138 106 1,509 706 15,887 Source: Boeing Company EXHIBIT 6 Lifecycle of Unit Sales (Averaged across the Boeing 757 and 767) Airframe Lifecycle Annual Units Sold/Total Units Sold 10% 9% 8% 7% 6% Percent of total unit sales 5% 4% 3% 2% 19 09 1 2 3 4 5 6 7 8 9 10 11 12 13 14 15 16 17 18 19 20 Year since introduction Source: Boeing Company Website, www.boeing.com 270 Part Three Estimating the Cost of Capital EXHIBIT 7 | Description of Product Configurations for the Baseline and Stretch Models of the 7E7 Boeing 7E7 Baseline Model Boeing 7E7 Stretch Brief Description: Brief Description: The Boeing 7E7 Baseline is a super-efficient air- The Boeing 7E7 Stretch is a slightly bigger version plane with new passenger-pleasing features. It will of the 7E7 Baseline. Both are super-efficient air- bring the economics of large jet transports to the planes with new passenger-pleasing features. The middle of the market, using 20% less fuel than any Stretch will bring the economics of large jet trans- other airplane its size ports to the middle of the market, using 20% less Seating: fuel than any other airplane its size. 200 passengers in three-class configuration Seating: 300+ in single-class configuration 250 passengers in three-class configuration Range: 350+ in single-class configuration 6,600 nautical miles Range: Configuration: 8,000 nautical miles Twin-aisle Configuration: Cross Section: Twin-aisle 226 inches Cross Section: Wing Span: 226 inches 186 feet Wing Span: Length: 186 feet 182 feet Length: Cruise Speed: 202 feet Mach 0.85 Cruise Speed: Cargo Capacity after Passenger Bags: Mach 0.85 5 pallets + 5LD3 containers Cargo Capacity after Passenger Bags: Program Milestones: 6 pallets + 8 LD3 containers Authority to offer: Program Milestones: Late 2003/Early 2004 Entry into service 2010 likely Assembly start: 2005 but depends on marketplace First flight: 2007 Certification/entry into service: 2008 Source: Boeing Company Case 17 The Boeing 787 271 EXHIBIT 8 | Forecast of Boeing 7E7 Free Cash Flows (s in millions) Assumptions Initial price of 7E7 $136.95 Initial price of 7E7 Stretch $170.87 Cost of goods sold (% of sales) 80% Working capital requirement (WCR) as a % of sales 6.7% General, selling, and administrative (GS&A) as a % of sales 89 R&D expense % of sales) 2.3% (excluding 2004-2007) Capital expenditure (% of sales) 0.16% (excluding 2004-2007) Development costs (2004-2009) $8,000 Total number of planes: yrs 1-20 2,500 Total number of planes: yrs 20-30 Same as year 20 Inflation 29 Marginal effective tax rate 35% 2004 2005 2006 2007 2008 Revenues Planes delivered 30 7E7 planes 30 7E7 Stretch planes 7E7 price $136.95 7E7 Stretch price Total product revenues 4.108.84 Cost of goods sold 3,286.91 Gross profit 821.73 Depreciation 7.50 29.44 10223 117.06 123.78 GS&A expense 308.15 Operating profit (before R&D) (7.50) (29.44) (102.23) (117.06) 389.80 R&D expense 300.00 900.00 3,000.00 900.00 694.50 Pretax profit (307.50) (929.44) (3,102.23) (1.017.06) (304.69) Taxes (or tax credit) (107.63) (325.30) (1,085.78) (355.97) (10664) After-tax profit (199.88) (604.13) (2,016.45) (661.09) (19805) Capital expenditure 100.00 300.00 1,000.00 300.00 206.57 Depreciation add-back 7.50 29.44 102.23 117.06 123.78 Change in WCA 275 28 Annual free cash flow $(292.38) S(874.70) $(2,914.22) $(844.03) $1556.13) .88 272 Part Three Estimating the Cost of Capital EXHIBIT 8 (continued) 2009 2010 2011 2012 2013 108 108 0 $139.69 Revenues Planes delivered 7E7 planes 7E7 Stretch planes 7E7 price 7E7 Stretch price Total product revenues Cost of goods sold Gross profit Depreciation GS&A expense Operating profit (before R&D) R&D expense Pretax profit Taxes (or tax credit) After-tax profit Capital expenditure Depreciation add-back Change in WCR Annual free cash flow 15,086.93 12,069.55 3,017.39 123.80 1.131.52 1.762.06 647.00 1.115.06 390.27 724.79 124.14 123.80 735 55 $(11.09) 64 51 13 $142.49 170.87 9.488.14 7.590.51 1.897.63 115.66 711.61 1,070.36 218 23 852.13 298 25 553.89 15.18 115.66 (375.12) $1,029.48 82 41 41 $145.34 174.28 13,104.49 10.483.59 2,620.90 108.67 982.84 1.529.40 301.40 1.227 99 429.80 798.19 20.97 108.67 242.30 $643.60 84 42 42 $148.24 177.77 13,692.60 10.954.08 2.738.52 102.83 1,026.94 1.608.75 314.93 1.293.82 452.84 840.98 21.91 102.83 39.40 $882.50 104 52 52 $151.21 181.33 17.291.79 13,833.44 3,458,36 99.64 1.296.88 2,061.83 39771 1,664.12 582.44 1,081.68 27 67 99.64 241.15 $912.51 2014 2015 2016 2017 2018 Revenues Planes delivered 7E7 planes 7E7 Stretch planes 7E7 price 7E7 Stretch price Total product revenues Cost of goods sold Gross profit Depreciation GS&A expense Operating profit (before R&D) R&D expense Pretax profit Taxes (or tax credit) After-tax profit Capital expenditure Depreciation add-back Change in WCR Annual free cash flow 136 68 68 $154.23 184.95 23.064.59 18.451.67 4.612.92 99.95 1.729.84 2.783.12 530.49 2.252.64 788.42 1.464.21 36.90 99.95 386.78 $1.140.48 119 60 59 $15732 188.65 20.569.48 16,455,59 4.113.90 100.84 1.542.71 2.470.35 473.10 1.997 25 699,04 1.298 21 3291 100.84 (167.17) $1,533 31 185 93 92 $160.46 192.42 32.626.19 26.100.95 6,525.24 103.70 2.446.96 3,974.57 750.40 3.224.17 1.128.46 2,095.71 52.20 103.70 807.80 $1,339.41 192 96 96 $163.67 196.27 34,554.82 27.643.86 6.910.96 106.87 2,591.61 4.212.48 794.76 3,417.72 1.196.20 2.221,52 55.29 106.87 129.22 $2,143.88 219 110 109 $166.95 200.20 40.185.75 32.148.60 8.007.15 110.54 3.013.93 4.912.68 924.27 3,988.40 1.395.94 2,592.46 64.30 110.54 377.27 $2.261.44 Case 17 The Boeing 7E7 273 EXHIBIT 8 (continued) 2019 2020 2021 2022 2023 Revenues Planes delivered 7E7 planes 7E7 Stretch planes 7E7 price 7E7 Stretch price Total product revenues Cost of goods sold Gross profit Depreciation GS&A expense Operating profit (before R&D) R&D expense Pretax profit Taxes (or tax credit) After-tax profit Capital expenditure Depreciation add-back Change in WCR Annual free cash flow 165 83 82 $170.29 204.20 30,878.29 24,702.63 6,175.66 112.89 2,315.87 3,746.89 710.20 3,036.69 1,062.84 1,973.85 49.41 112.89 (623.60) $2,660.94 149 75 74 $173.69 208.29 28.440.04 22.752.03 5.688.01 114.85 2,133.00 3,440.15 654.12 2.786.03 975.11 1.810.92 45.50 114.85 (163.36) $2,043.63 10B 54 54 $177.17 212.45 21.039.33 16,831.46 4,207.87 115.88 1,577.95 2.514.04 483.90 2.030.13 710.55 1,319.59 33.66 115.88 (495.85) $1,897.65 115 58 57 $180.71 216.70 22.833.05 18,266.44 4,566.61 117.16 1.712.48 2.736.97 525.16 2.211.81 774.13 1.437.68 36.53 117.16 120.18 $1,398.13 119 60 59 $184.32 221.03 24,100.43 19,280 34 4.820.09 118.63 1,807.53 2.893.92 554.31 2.339.61 818.86 1,520.75 38.56 118.63 84.91 $1,515.90 2024 2025 2026 2027 2028 $ 150 Revenues Planes delivered 7E7 planes 7E7 Stretch planes 7E7 price 7E7 Stretch price Total product revenues Cost of goods sold Gross profit Depreciation GS&A expense Operating profit (before R&D) R&D expense Pretax profit Taxes (or tax credit) After-tax profit Capital expenditure Depreciation add-back Change in WCR Annual free cash flow 136 68 68 $188.01 225.46 28.115.61 22,492.49 5,623.12 116.20 2,108.67 3,398.25 646.66 2.751.60 963.06 1.788.54 44.98 118.20 269.02 $1,590.73 75 75 $191.77 229.96 31,630.06 25,304.05 6,326.01 105.31 2,372.25 3,848.45 727.49 3.120.96 1,092.33 2,028.62 50.61 105.31 235.47 $1.847.86 120 60 60 $195.61 234,56 25.810.13 20.648.10 5,162.03 62.54 1.935.76 3,163.73 593.63 2,570.09 899.53 1.670.56 41.30 62.54 (389.94) $2.081.74 115 58 57 $199.52 239.26 25,209.53 20.167.63 5,041 91 50.92 1.890.72 3,100.27 579.82 2,520.45 882.16 1,638.29 40.34 50.92 (40.24) $1,689.12 115 58 57 $203.51 244.04 25.713.72 20,570.98 5.142.74 43.54 1.928.53 3,170.68 591.42 2.579.26 902.74 1.676.52 41.14 43.54 33.78 $1,645.13 274 Part Three Estimating the Cost of Capital EXHIBIT 8 (continued 2029 2030 2031 2032 2033 115 115 Revenues Planes delivered 7E7 planes 7E7 Stretch planes 7E7 price 7E7 Stretch price Total product revenues Cost of goods sold Gross profit Depreciation GS&A expense Operating profit (before R&D) R&D expense Pretax profit Taxes (or tax credit) After-tax profit Capital expenditure Depreciation add-back Change in WCR Annual free cash flow 115 58 57 $207.58 248.92 26,228.00 20,982.40 5.245.60 39.86 1.967.10 3,238.64 603.24 2,635.39 922.39 1,713.00 41.96 39.86 34.46 $1.676.45 58 57 $211.73 253.90 26.752.56 21.402.05 5,350.51 41.10 2,006.44 3,302.97 615.31 2.687.66 940.68 1.746.98 42.80 41.10 35.15 $1.710.13 58 57 $215.96 258.98 27,287.61 21.830.09 5,457 52 42.13 2.046.57 3,368.82 627.62 2.741.21 959.42 1.781.78 43.66 42.13 35.85 $1,744.41 115 58 57 $220.28 264.16 27.833.36 22.266.69 5,566.67 43.19 2,087.50 3,435.98 840.17 2.795.81 978.53 1,817.28 44.53 43.19 36.57 $1.779.37 115 58 57 $224.69 269.44 28,390.03 22.712.02 5,67801 44.07 2,129.25 3,504.68 65297 2.851.71 998.10 1,853.61 45.42 44.07 37.30 $1.814.96 2034 2035 2036 2037 Revenues Planes delivered 7E7 planes 7E7 Stretch planes 7E7 price 7E7 Stretch price Total product revenues Cost of goods sold Gross profit Depreciation GS&A expense Operating profit (before R&D) R&D expense Pretax profit Taxes (or tax credit) After-tax profit Capital expenditure Depreciation add-back Change in WCR Annual free cash flow 115 58 57 $229.18 274,83 28.957.83 23.166.26 5.791.57 44.59 2,171.84 3,575.14 666.03 2.909.11 1.018.19 1.890.92 46.33 44.59 38.04 $1,851.14 115 58 57 $233.77 280.33 29,536.99 23,629.59 5.907.40 45.33 2.215.27 3.646.80 679.35 2.967.45 1.038.61 1.928.84 4726 45.33 38.80 $1.888.10 115 58 57 $238.44 285.93 30,127.73 24.102.18 6,025.55 45.25 2.259.58 3,720.72 692.94 3,027.78 1,059.72 1.968.06 48.20 45.25 39.58 $1,925.52 115 58 57 $243.21 291.65 30.730.28 24,584.22 6.146.06 45.00 2,304.77 3.796.21 706.80 3.089.41 1.081.29 2.008.12 49.17 45.00 40.37 $1,963.65 Case 17 The Boeing 7E7 275 15% EXHIBIT 9 Sensitivity Analysis of Project IRRs by Price, Volume, Development, and Production Costs Price Premium Above Expected Minimum Price Unit Volume (First 20 Years) 0% 5% 10% 1,500 10.5% 10.9% 11.3% 1.750 11.9% 12.3% 12.7% 2,000 13.0% 13.5% 13.99 2.250 14.1% 14.6% 15.1% 2,500 15.2% 15.7% 16.1% 2.750 16.1% 16.6% 17.1% 3,000 17.1% 17.6% 18.1% Development Cost of Goods Sold as a Percentage of Sales Costs 78% 80% 82% $6,000,000,000 21.3% 18.7% 16.9% $7,000,000,000 19.4% 17.0% 14.4% $8,000,000,000 17.9% 15.7% 13.2% $9,000,000,000 16.6% 14.5% 12.1% $10,000,000,000 15.5% 13.5% 11.2% Note: The IRR consistent with Dase case assumption is 15.7%, and is indicated in talies in the table Source: Case writer's analysis 11.7% 13.1% 14.4% 15.5% 16.6% 17.6% 18.6% 84% 12.6% 11.3% 10.3% 9.4% 8.6% 276 Part Three Estimating the Cost of Capital EXHIBIT 10 Information on Comparable Companies (Specially calculated betas estimated from daily stock and market returns over the periods indicated) Lockheed Northrop Boeing Martin Grumman Raytheon Percentage of revenues derived from government (defense and space) 46% 93% 91% 73% Estimated betas 1. Value Line 1.05 0.60 0.70 0.80 2. Calculated against the S&P 500 index 60 months 0.80 0.36 0.34 0.43 21 months 1.03 0.38 0.31 0.46 60 trading days 1.45 0.34 0.27 0.66 3. Calculated against the NYSE composite index 60 months 1.00 0.44 0.59 21 months 1.17 0.44 0.36 0.53 60 trading days 1.62 0.37 0.30 0.73 Effective marginal tax rate 0.35 0.35 0.35 0.35 Market-value debtlequity ratios 0.525 0.410 0.640 0.624 Sources: Case writer's analysis and Value Line Investment Survey Value Line betas are calculated from a regression analysis between the weekly percentage change in price of a stock and the weekly percentage changes of the New York Stock Exchange Composite Index. The beta is calculated using the last five years of data Regression periods for the 60-day, 21-month, and 60-month begin on March 20. 2003. September 17, 2001, and June 16, 1998. respectively. Regression periods and on June 16, 2003 0.49 Case 17 The Boeing 7E7 277 EXHIBIT 11 Outstanding Bonds of the Boeing Company as of June 2003 (s values in millions) Debt Debt Amount Rating Coupon Maturity Price Yield To Maturity $202 A- 7.625% 2/15/2005 106.175 3.911% $298 A 6.625% 6/1/2005 105.593 3.393% $249 A- 6.875% 11/1/2006 110.614 3.475% $175 A- 8.100% 11/15/2006 112.650 4.049% $349 A- 9.750% 4/1/2012 129.424 5.470% $597 A- 6.125% 2/15/2013 103.590 4.657% $398 A. 8.750% 8/15/2021 127.000 6.239% $300 A- 7.950% 8/15/2024 126.951 5.732% $247 7.250% 6/15/2025 114.506 6.047% $249 A- 8.750% 9/15/2031 131.000 6.337 $173 8.625% 11/15/2031 138.974 5.805% $393 A- 6.125% 2/15/2033 103.826 5.850% $300 A- 6,625 2/15/2038 106.715 6.153% $100 7.500% 8/15/2042 119.486 $173 6.173% 7.825% 4/15/2043 132.520 5.777 $125 6.875% 10/15/2043 110.084 6.1915 Note: This table does not include the outstanding debt of Boning's financing subsidiary. Boeing Capital Corporation Sources: Boeing Company 10-Q, Bloomberg Financial Services, and Mergent Online. 278 Part Three Estimating the Cost of Capital APPENDIX Assumptions underlying the Forecast of Cash Flows Revenue Estimation In order to project revenues for the project, several assumptions were made about the expected demand and timing for the units, their price and price increases Demand Boeing estimated that in the first 20 years they would sell 2,000-3,000 units 'Frost & Sullivan aviation industry analysts, predicted at least 2.000 units Analysis assumes 2.500 units in years 1 through 20 Years 20-30 assume unit sales equal to year 20. First delivery of 7E7 expected in 2008 and 7E7 Stretch in 2010. Timing of demand Units sold per year is the percentage of the total units in the first 20 years as shown in Exhibit 6. Exhibit 6 uses an historical average of the 757 and 767 unit sales during their first 20 years. The Boeing 7E7 is expected to be a replacement aircraft for the 757 and 767. Analysis assumes the 7E7 Stretch accounts for only 20% of unit sales in its first year of delivery and 50% thereafter. It the total number of unit sales per year is an odd number, the 7E7 units are rounded up and the 7E7 Stretch are rounded down. Price: The expected price of the 7E7 and Stretch version is a function of the 767 and 777 prices in 2002 Using range and capacity as the primary variables, the 7E7 and 7E7 Stretch would be expected to have a mini- mum price of $114.5 million and $144.5 million respectively in 2002 dollars. This does not include a premium for the expected lower operating costs and flebility of the 7E7. The analysis assumes a 5% price premium as a benchmark, resulting in expected prices of $120.2 million and 5151.7 million in 2002 Rate of price increases: Aircraft prices are assumed to increase at the rate of inflation. Inflation is assumed to be 2% per year until 2037. Expense Estimation Cost of goods solct. The average cost of goods sold for Boeing's commercial-aircraft division was 80% over the three-year period 2000-2002. The range was 77-9% to 81.15. The analysis assumes 80% as the COGS General, selling and administrative expense: The average general, selling and administrative expense for Boeing was 7.5% over the three-year period 2000-2002. The range was 7.45 to 7.7%. The analysis assumes 7.5% as the general, selling and administrative expense. Depreciation: Boeing deprecated its assets on an accelerated basis. The forecast uses 150% declining balance depreciation with a 20-year asset life and zero salvage value as the base. Research and development as a percentage of sales: The average research and development expense for Boeing's commercial-aircraft division as a percentage of commercial-aircraft sales was 2.3% over the three-year period 2000-2002. The range was 1.8% to 2.7%. During that period, Boeing did not have any extraordinary new commercial-aircraft development expenses. The analysis, therefore, assumes 2.3% as the estimated research and development expense. That does not include the initial research and development costs required to design and develop the 7E7, Tax expense: Boeing's expected marginal effective tax rate was 35% Other Adjustments to Cash Flow Capital expenditures. The 1998-2002 average for capital expenditures as a percentage of sales was 0.93%. During this period, Boeing did not have any extraordinary new commercial-aircral development expenses. At the time, Boeing had six families of aircraft the 717.737,747.757.767 and 777. The average capital expendi- tures per family line, as a percentage of sales, was therefore 0.16%. This does not include the initial capital ex- penditure costs required to develop and build the 7E7 Change in working capital requirements (WCR: For the years 2000-2002. Boeing had negative working capital due to factors such as advance customer payments. The analysis assumes that the commercial segment of Boeing would require positive working capital. The years prior to 2000, Boeing had positive working capital. The 1997-1999, three-year average of working capital as a percentage of sales is 6.7% with a range from 3.5% to 11.2%. The analysis assumes this percentage New Team, Name for Boeing "Super-Efficiene" Je,"SeamleTimex. 30 January 2003, 1. --An Ongoing Rivalry;" Aviation Fonday, August 2003 COURI UVERE, DUSJ and development expense. That does not include the initial research and development costs required to design and develop the 7E7 Tax expense: Boeing's expected marginal effective tax rate was 35% Other Adjustments to Cash Flow Capital expenditures: The 1999-2002 average for capital expenditures as a percentage of sales was 0.93%. During this period. Boeing did not have any extraordinary new commercial-aircraft development expenses. At the time. Boeing had six families of aircraft the 717, 737, 747,757.767 and 777. The average capital expendi- tures per family ine, as a percentage of sales, was therefore 0.16%. This does not include the initial capital ex penditure costs required to develop and build the 7E7 Change in working capital requirements (WCR: For the years 2000-2002 Boeing had negative working capital due to factors such as advance customer payments. The analysis assumes that the commercial segment of Boeing would require positive working capital. The years prior to 2000, Boeing had positive working capital The 1997-1999, three-year average of working capital as a percentage of sales is 6.7% with a range from 3.5% to 112%. The analysis assumes this percentage New Team. Name for Hocing Super-Eficient I," Sante Timex. 30 January 2011 - An Ongoing Rivalry." Antonio Today, August 2008 Case 17 The Boeing 77 279 APPENDIX (continued Initial development costs: Development costs include the research and capital requirements needed to design and build the 7E7. Analysts estimated between S6 billion and S10 billion. The analysis assumes $8 billion Assuming a launch in 2004, analysts expected spending to peak in 2006. Timing of the development costs are assumed to be 2004:5%, 2005 15% 2006: 50% 2007: 15%. 2006: 10% and 2009.5% It is estimated that 75% of the initial development costs are research and development expenses, while the remaining 25% are capital expenditures SBoeing Plays Defense. Beness ok. 3 June 2003. Source: Case writer's analysis. 259 Case 17 The Boeing 7E? to have raised serious concerns regarding the cost of the 7E7. While the cost of devel- oping the 7E7 project could be as high as $10 billion, there was an imminent veto threat if that number did not shrink by billions. More specifically the board wanted to keep 7E7 development costs down to only 40% of what it took to develop the 777. An additional pressure from the board was to keep the 7E7 per-copy costs to only 60% of the 777 costs. In response, Philip Condit, Boeing's CEO and chair, was quoted as saying that "Boeing has a responsibility to develop jetliners for less. He knew, however, that if Boeing did not take bold risks in the commercial-aircraft industry that their days as a serious competitor to Airbus were numbered. Commercial-Aircraft Industry In 2002, two companies, Boeing and Airbus, dominated the large plane (100+ seats) commercial-aircraft industry. While Boeing historically held the lead in this market. through a number of measures Airbus became number one. In 2002. Airtus received 233 commercial orders compared to Bocing's 176 orders, representing a 575 unit market share and an estimated 535 dollar value market share. Airbus Industry Airbus was understandably proud of its growth. Established in 1970, by a consortium of European companies, it took Airbus 23 years to deliver its first 1000 aircrafts, another six years to deliver the next 1000, and only another three years (by 2002) to pass the 3000 aircraft milestone. In 1999, for the first time in its history. Airbus recorded more plane orders than its rival, Bocing Airbus's large plane commercial-aircraft products included the A300/310, A320 A330/340, and A380 families. Airbus touted the A300310 family as having the flexibility to serve short-, medium- and extended-range routes. The widebody. twin-engine aircraft was considered mid-size, with a typical passenger configuration of about 250 passengers. This family first flew passengers in 1983, and it was this aging flect that provided a replacement opportunity for Boeing's 7E7. However, while Boeing was betting on the future demand for mid-size aircraft. Airbus announced its A380, superjumbo four-engine jet in 2000. The A380 was due to fly in 2006 with a 550-passenger configuration and long distance range of up to 8000 miles. It would be the largest passenger aircraft ever built. The Boeing Company Boeing was split into two primary segments commercial airplanes and integrated defense systems. In 2002. it was awarded 516.6 billion in defense contracts, second "Losing Groud to Aistus, Boeing Faces a Key Choice." Wal Street Journat. 21 April 2003 2002 Commercial Results" wwwirbes.com In 2001. Airtes formally became a single integrated entity through the transfer of Airbus latelsets to the newly incorporated company. European Aerotic Defense and Space Company (EADS) owned 807 of the new company, and BAE systems owned the remaining 205. 260 Pan Thee Estimating the Cost of Capital only to Lockheed Martin with $17.0 billion. Exhibit 1 shows that in 2002. cach seg. ment earned Boeing's revenues almost equally. In addition, while commercial-aircraft revenues had been falling, defense revenues had been rising. Analysts believed that Boeing was able to transfer significant amounts of technology from the defense R&D to the commercial-aircraft segment. The commercial-aircraft segment produced and sold six main airframes designed to meet the needs of the shon- to long-range markets: the 717.737, and 757 standard- body models and the 747, 767, and 777 wide-body models. As of December 31, 2002, Boeing undelivered units under firm order of 1083 commercial aircraft and had a declining hacklog of about $68 billion. For 2003, it projected 280 commercial-aircraft deliveries and expected between 275 and 300 in 2004. Boeing estimated that in 2003, the revenues for its commercial-airplane segment would be approximately 522 billion, down from $28 billion in 2002. Recognizing the negative impact of the September 11th attacks on commercial-aircraft demand, Boeing cut the production rates for 2002 in half in order to maintain profitability in that segment. Exhibits 2 and 3 show Boeing's balance sheet and income statement respectively, While Boeing's earnings were down significantly from 2001 to 2002, most of this was the result of an accounting change (SFAS No. 142). However, a drop in commercial- airplane deliveries from 527 in 2001 to 381 in 2002 also contributed to the decline. Demand for Commercial Aircraft The long-term outlook for aircraft demand seemed positive. Boeing's Market Out- look said the following: In the short term, air travel is influenced by business cycles.consumer confidence, and exogenous events. Over the long-term, cycles smooth out, and GDP, international trade, lower fares, and network service impeovements become paramount. During the next 20 years, economies will grow annually by 3.25and air travel will continue its historic relationship with GDP by growing at an average annual rate of 5.1%. As shown in Exhibit 4, Boeing's 20-year forecast from 2003 to 2022, was for 24.276 new commercial aircraft in 2002, valued at $1.9 trillion. The company predicted a composition of 4.303 smaller regional jets (fewer than 90 seats): 13,647 single-aisle airplanes: 5.437 intermediate twin-aisle airplanes and 889 747-size or larger airplanes. This prediction reflected a world fleet that would more than double, with one-fourth of the market coming from aircraft replacement and three-fourths from projected pas- senger and cargo growth Exhibit 5 illustrates Airbus's 20-year predictions for the years 2000-2020, Although the report was dated 2002, because of the September 11 attacks, numbers included the year 2000, to serve as a benchmark year. For that period, Airbus predicted The primary sources for commercial aircraft demand estimates include Boeing's 2003 Current Marker Outlook and Airbus's 2002 Global Market Forecase 2001-2020. While boch reports recognized the negative effects of exogenous events such as September 11, 2001, they both agreed on a healthy long-term outlook. 251 Case 17 The Bacing TEZ the delivery of 15,887 new commercial aircraft in 2002. with a value of (U.S. dollars) $1.5 trillion. This included 10.201 single-aske aircraft: 3,842 twin-aisle aircraft: 1.138 very large aircraft, and 706 freighters. The 15,887-unit forecast did not include planes with less than 90 seats. Although Bocing and Airbus's numbers are not directly comparable due to the slightly different time periods and aircraft classifications, it appeared that Airbus was more optimistic about the market for large aircraft than Boeing was. While Airbus predicted it to be a $270 billion market, including 1138 passenger units, Boeing pro- jected only $214 billion with 653 passenger units. Boeing, however, estimated that the share of intermediate-size planes would increase from 18 to 229. In its fore cast, Boeing acknowledged that intermediate-size airplanes would economically allow airlines to fly the increased frequencies, city pairs, and nonstop flights requested by passengers. According to a recent study by Frost & Sullivan, they believed that the Airbus market projection for the A380 was over-optimistic.*** Aircraft Development and Lifecycle The development of a new airframe was characterized by huge initial cash outflows that might require between one and two decades to recoup. For example, the devel- opment costs for the Boeing 777 were rumored to be 57 billion. Any pricing would not only have to recoup the upfront development costs but also the production costs. In addition, pricing would be subject to rigorous, competitive pressures. In short, because of the financial strains a new product line might create, each new aircraft was a "bet the ranch" proposition. Over time, survival in the industry depended on intro- ducing successful products and having the deep financial pockets with which to sur- vive the initially gushing cash flow. While aircraft sales were subject to short-term. cyclical deviations, there was some degree of predictability in sales . Sales would typically peak shortly after the introduction of the new aircraft, and then fall. Thereafter, sales would rise and fall as derivatives of the aircraft wete offered. Exhibit 6 shows the cycles for the first 20 years of the 757 and 767 sales. The 7E7 The concept of the Boeing 7E7 was driven by customer requirements. Boeing onginally announced in March 2001, its plans to build the Sonic Cruiser, a plane that would fly just below the speed of sound. The success of the Cruiser depended on whether pas- sengers would pay a premium for a faster flight. However, potential airplane customers who had been interested in the Cruiser during a robust, commercial-air travel market were now focusing on survival. The events of September 11 and the bursting of the technology bubble led to a significant decline in airplane orders. As a result. Boeing solicited updated feedback from a number of potential customers who would soon need An Ongoing Rivalry." Anionica TecayAugust 2003 262 Part Three Estimating the cost of Capital to replace their aging fleet of mid-range planes, such as the 7575, 7675, A300, A310S. A321s, and A330, Overwhelmingly, the revised message from customers was for a plane with lower operating costs. Based on discussions with over 40 airlines throughout the world, Bair identified a fresh market to replace mid-size planes, based not only on lower operating costs, but also on the creation of a mid-size plane that could travel long distances, a feat previously viable by only large planes, such as the 747. Such flexibility would allow airlines to offer nonstop service on routes that required long-range planes but did not justify the subsequent larger size. Bair estimated there to be more than 400 city pairs (e.g.. Atlanta-Athens) that could be served efficiently on a nonstop basis by the 7E7. Boeing was considering two new members for the 7E7 family, a basic and a stretch version. Exhibit 7 gives Boeing's description of the two configurations. Other improvements for passengers included wider aisles, lower cabin altitude, and increased cabin humidity. In addition, the planes would include systems that provided in-flight entertainment, Internet access, real-time airplane systems and structure health moni- toring, and crew connectivity. Furthermore, Boeing claimed the 7E7 would have the smallest sound "footprint" with the quietest takeoff and landing in its class Boeing projected a demand for between 2000 and 3000 planes of the 7E7 type within 20 years of each one entering service. A study by Frost & Sullivan predicted the sale of at least 2000 B7E7s." However, the demand was highly dependent on whether Boeing could deliver the promised 20% cheaper fuel costs and the range flex- ibility in a mid-size aircraft. Furthermore, if the range flexibility did require snap-on wings, such a design may significantly increase the building costs of the aircraft. Not only did Boeing face the engineering uncertainty of being able to deliver such an air- craft . but also the risk of its duplication by Airbus. Airbus had already stated that if the fuel efficiency was primarily generated by new engine designs, then it would sim- ply order the more efficient engines for its planes. Any uncertainty in the 7E7 plane specifications and risk of competition clearly put downward pressure on both the price Boeing could demand, as well as the number of units it would be able to sell. Financial Forecast and Analysis Exhibit 8 contains a 20-year forecast of free cash flows from the Boeing 7E7 project consistent with public information released by Boeing, Airbus, analysts, and other experts in the field. See the Appendix for detailed forecast assumptions. The primary implication of the forecast is that the 7E7 project would provide an internal rate of retum (IRR) close to 16%. This assumes that Boeing would not only deliver the promised plane specifications, but that Airbus would be unable to replicate the 7E7 efficiencies. Based on both analysts and Boeing's expectations, the base case assumes that Boeing could sell 2500 units in the first 20 years of delivery. Pricing was estimated using 2002 prices for Boeing's 777 and 767. The 7E7 would be a hybrid of the two planes in terms of the number of passengers and range. By interpolating between the An Onning Rivalry 263 Case 17 The Boeing 767 777 and 767 prices, it was possible to estimate the value placed on the range and number of passengers. Using this methodology, without any premium for the prom- ised lower operating costs, the minimum price for the 7E7 and 7E7 Stretch was esti- mated to be $114.5 million and $144.5 million, respectively, in 2002. The forecast assumed that customers would be willing to pay a 5% price premium for the lower operating costs. The IRR, which is consistent with "base case assumptions, was 15.7%. But, the estimate of IRR was sensitive to variations in different assumptions. In particular, some obvious uncertainties would be the number of units that Boeing would be able to sell and at what price. For example, if Boeing only sold 1.500 units in the first 20 years, then, as shown in Exhibit 9, the IRR would drop to 11%. This might occur if air travel demand worsened, or if Airbus entered this segment with a new compet- ing product Additional unknown variables were the development costs and the per-copy costs to build the 7E7, Boeing's board was anxious to minimize those costs. The forecast assumes $8 billion for development costs; however, analyst estimates were in the $6 billion to S10 billion range. The cost to manufacture the 7E7 was also subject to great uncertainty. On the one hand, engineers were challenged to build a mid-size air- craft with long-range capabilities. The engineering design to achieve this could push building costs up significantly. Conversely, if Boeing succeeded in using composite materials, which required a fraction of the normal assembly time, then construction costs would be lower. Consistent with Boeing's history, the base case assumes 80% as the percentage of cost of goods sold to sales. As shown in Exhibit 9, however, the IRR of the 7E7 was very sensitive to keeping production costs low Cost of Capital Boeing's weighted average cost of capital (WACC) could be estimated using the following well-known formula: WACC = (percent Debt)(X - 1.) + (percent Equity)(a) where: = Pretax cost of debt capital 1 = Marginal effective corporate tax rate percent Debt - Proportion of debt in a market - value capital structure - Cost of equity capital percent Equity Proportion of equity in a market - value capital structure Exhibit 10 gives information about betas and debt/equity ratios for Boeing and comparable companies. Exhibit 11 provides data about Boeings outstanding debe issues. While Boeing's marginal effective tax rate had been smaller in the past, it currently was expected to be 35%. In June 2003, the yield on the three-month US. Treasury bill was 0.85%, and the yield on the 30-year Treasury bond was 4.56%. On June 16, 2003. Boeing's stock price closed at $36.41. 264 Part Three Estimating the Cost of Capital Analysts pointed out that Boeing actually consisted of two separate businesses: the relatively more stable defense business and the conversely more volatile com- mercial business. Defense corporations were the beneficiaries when the world became unstable due to the terrorist attacks on September 11, 2001. Furthermore, the United States, along with some of its allies, went to war against Iraq on March 20, 2003. While Bush declared an end to major Iraqi combat operations on May 1, 2003, as of June 16, the death toll in Iraq continued to rise on a daily basis. A different type of risk emanated with the outbreak of SARS. On February 1, 2003. China announced the discovery of the deadly and contagious illness that subsequently spread to Canada and Australia. As of June 16, travel warnings were still outstanding. Thus, the question arose of whether one should estimate Boeing's cost of capital to serve as a benchmark- required rate of return. Would a required return on a portfolio of those two businesses be appropriate for evaluating the 7E7 project? If necessary, how might it be possible to isolate a required return for commercial aircraft? Conclusion Within the aircraft-manufacturing industry, the magnitude of risk posed by the launch- ing of a major new aircraft was accepted as a matter of course. With huge, upfront, capital costs in an environment of intense technology and price competition, there was no guarantee of success or major significant losses if the gamble did not pay off. At a time of great political and economic uncertainty, Michael Bair said: Clearly, we have to make a compelling business proposition. It could be [that] we'll still be in a terrible business climate in 2004. But you can't let what's happening today cause you to make bad decisions for this very long business cycle. This plane is very important to our future." Central to any recommendation that Bair would make to Boeing's board of direc- tors was an assessment of the economic profitability of the 7E7 project. Would the project compensate the shareholders of Boeing for the risks and use of their capital? Were there other considerations that might mitigate the economic analysis? For instance, to what extent might organizational and strategic considerations influence the board? If Boeing did not undertake the 7E7, would it be conceding leadership of the commercial-aircraft business to Airbus? New Team, Name for Boeing 'Super-Efficient" Jet." Seanle Times, 30 January 2003 1 of 1 i Case 17 The Boeing 7E7 265 2000 $31,171 19.963 187 $51,321 EXHIBIT 1 Revenues, Operating Profits, and Identifiable Assets by Segment for the Boeing Company 2002 2001 Revenues Commercial airplanes $28,387 $35,056 Integrated defense systems 24,957 22.815 Accounting eliminations and other 725 1.047 Total $54.069 $58,918 Operating Profit Commercial airplanes $2.847 $2.632 Integrated defense systems 2,009 2,965 Accounting eliminations and other (988) (1.701) Total $3,868 $3,896 Identifiable Assets Commercial airplanes $9.726 $10,851 Integrated defense systems 12.753 12.461 Unallocated and other 29,863 25,666 Total $52,342 $48.978 Source: Boeing Company, 2002 Annual Report $2.736 1,002 (680) $3,058 $10,367 12.579 20.588 $43.534 266 Part Three Estimating the cost of Capital EXHIBIT 2 | Boeing Balance Sheets ($ in millions) 2002 2001 $2,333 5,007 6.184 3.331 Assets Cash and cash equivalents Accounts receivable Inventories, net of advancos, progress billings, and reserves Other current assets Total current assets Customer and commercial financing-net Property, plant, and equipment-net Goodwill and other acquired intangibles.net Prepaid pension expense Deferred income taxes and other assets Total assets 16,855 10,922 8.765 3.888 6,671 5.241 $52 342 $633 5,156 7.559 3.497 16.845 9.345 8,459 6,447 5,838 2,044 $48.978 $13.739 1.814 4257 19,810 11.705 12.589 542 $14.237 1.399 4,930 20,566 5,922 10.866 799 Liabilities and Shareholders' Equity Accounts payable and other labities Short-term debt and current portion of long-term dett Other current liabilities Total current abilities Accrued retiree health-care and pension-plan kabilly Long-term debt Other liabilities Shareholders' equity Common shares Retained earnings Treasury shares Total shareholders equity Total abilities and shareholders' equity Source: Boeing Company, 2002 Annual Report 1,831 14 262 (8,397) 7.698 $52,342 4,994 14,340 (8.509) 10,825 $48.978 Case 17 The Boeing 7E7 267 EXHIBIT 3 | Boeing Income Statements (5 in mions, except per stare data) 2002 2001 Sales and other operating revenues 554.069 558,198 Cost of products and services 45.490 48,778 General and administrative expense 2.534 2.389 Research and development expense 1.639 1,936 Impact of September 11, 2001 charges (recoveries) 21 935 Other operating expenses 531 264 Earnings from operations 3.868 3.898 Other income expense 42 318 Interest and debt expense 730 (650) Earnings before income taxes 3.100 3,564 Income taxes 361 738 Net earnings before cumulative effect of counting change 2,319 2,826 Cumulative effect of accounting change, net of tax 1.827 Net earnings 3492 $2.827 Earnings per share $0.62 $3.46 Souto toong Company, 2000 Antal en Woeng average tax rate carattert with uponed francul performance tur 2002 was 271 Yet lacind'o marginal active tax rato 26 Part Three Estimating the Cost of Capital EXHIBIT 4 | Boeing Delivery Distribution Forecast 2003-2022 Passenger Units 2002 Dollars Freighter Units Seat Category Models (billions) Total Units Single-aisle Small and intermediate Fewer than 90 seats 96.5 4,303 regional Jets Re
Step by Step Solution
There are 3 Steps involved in it

Get step-by-step solutions from verified subject matter experts