Answered step by step
Verified Expert Solution
Link Copied!

Question

1 Approved Answer

Write an m-file that graphs the debt/earnings of the following three scenarios. All three lines must be on the same graph, and they must be

Write an m-file that graphs the debt/earnings of the following three scenarios. All three lines must be on the same graph, and they must be easily distinguishable with line properties. The graph must have a legend and appropriate labels (x, y, title). The graph must cover a range from 18 years to 65 years. Your m-file must be well commented, it must calculate the data itself (i.e. you cant pre-calculate values and hard-code them in), and all values must be declared as variables to allow easy experimentation.image text in transcribed

Complete the following exercises and submit your .m, supporting files, and this word document with your results and answers to possible questions via BlackBoard. Please follow the instructions in syllabus regarding electronic submissions. 2) Write an m-file that graphs the debt/earnings of the following three scenarios. All three lines must be on the same graph, and they must be easily distinguishable with line properties. The graph must have a legend and appropriate labels ( x,y, title). The graph must cover a range from 18 years to 65 years. Your m-file must be well commented, it must calculate the data itself (i.e. you can't pre-calculate values and hard-code them in), and all values must be declared as variables to allow easy experimentation. Line 1: At 18, a student goes to school for a B.S. for 5 years costing $28,000 a year. Upon graduation, the student earns $60,000 a year. Line 2: After getting a B.S. as the first student, a second student goes to school for an M.S. for 2 more years costing $12,000 a year. Upon graduating with a M.S., the student earns $10,000 more a year than the student with a B.S. degree. Line 3: After getting an M.S. as the second student, a third student goes to school for a Ph.D. (because his friends didn't stop him) for 5 more years costing $8,000 a year. Upon graduating with a Ph.D., the student earns $10,000 more a year than with a M.S. degree. Hints: - For a line, create an array of 48 values, representing years 18 through 65. - The first element should be 0, since at year 18, the student hasn't attended a year of college and hasn't accrued any debt yet. - Create a set of "for" loops for each stage that the student passes through. Each "for" loop generates the next value in the array by adding the appropriate variable to the previous array element. For example, the first student would have a "for" loop that executed 5 times while in college, and a second loop that executed 42 times while working. ...or ... You could have a single "for" loop that executed 47 times. Inside the loop, use "if", statements to check the value of the loop counter and add to the appropriate variable depending on its value

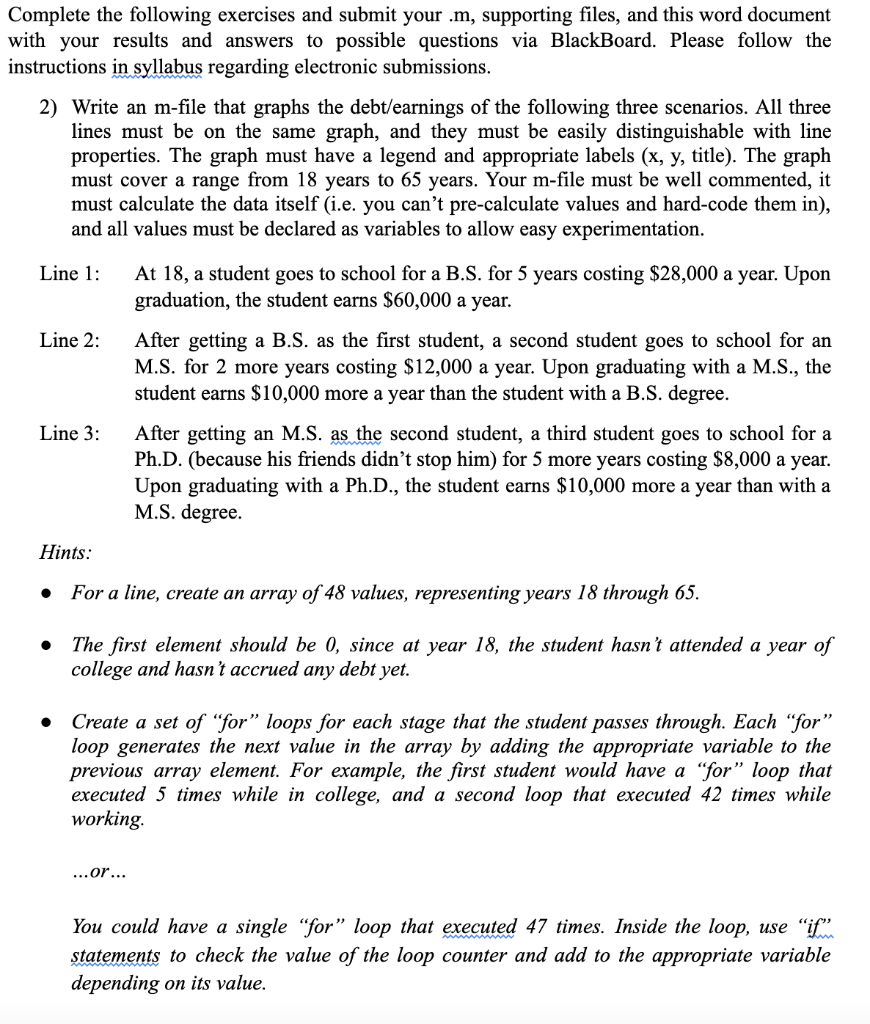
Step by Step Solution

There are 3 Steps involved in it

Step: 1

blur-text-image

Get Instant Access to Expert-Tailored Solutions

See step-by-step solutions with expert insights and AI powered tools for academic success

Step: 2

blur-text-image

Step: 3

blur-text-image

Ace Your Homework with AI

Get the answers you need in no time with our AI-driven, step-by-step assistance

Get Started

Recommended Textbook for

More Books

Students also viewed these Databases questions

Question

2. How well does the collaborator address the larger issues?

Answered: 1 week ago

Question

How do you add two harmonic motions having different frequencies?

Answered: 1 week ago