write code for R to solve. provide interpretation of results
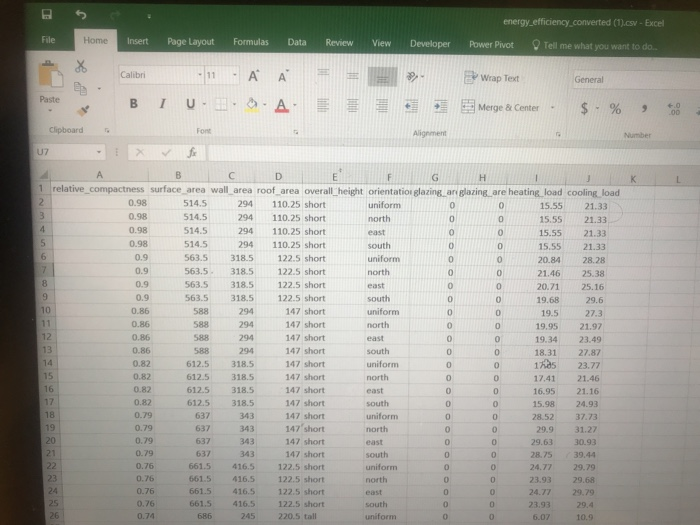
energy efficiency.converted (1).csw- Excel File Home Insert Page Layout Formulas Data Review View Developer Power Pivot T Tell me what you want to do... Calibri Wrap Text Merge & Center . Clipboard Alignment 1 relative_ compactness surface area wall area roof area overall height orientation glazing, ar glazing, are heating load cooling load 514.5 514.5 294 110.25 short 294 110.25 short 4.5 294 110.25 short 294 110.25 short 563.5 318.5 122.5 short 0.9563.5318.5122.5 short 563.5 318.5122.5 short 563.5318.5122.5short 147 short 147 short 147 short 147 short uniform 15.55 21.33 015.55 21.33 15.55 21.33 O15.55 21.33 O 20.84 28.28 021.46 25.38 020.7125.16 19.68 29.6 east 514.5 uniform 19.9521.97 19.34 23.49 18.31 27.87 1 23.77 17.41 21.46 6.9521.16 5.9824.93 28.52 37.73 29.9 31.27 east 588 294 612.5318.5 612.5318.5 612.5318.5 612.5318.5 147 short 147 short 147 short 147 short 147 short 147 short 147 short 661.5 416.5122.5 short 661.5416.5122.5 short 16.5 122.5 short 661.5416.5122.5 short 9.6330.93 637 343 28.75 39.44 24.7729.79 23.9329.68 24.7729.79 uniform 661.5416.S 220.5 tall Use the file energy efficiency converted.csy for this question. The column names are self-explanatory. The data set consists of information about several buildings. It shows different characteristics of each building and the building's heating and cooling load Read the data into a data frame called ee. 1. Write R code using ggplot to generate a histogram of heating load have 15 bins instead of the default 30. Adjust the plot so that the tick mark on the axis showing the count are spaced at intervals of 50. You need not show the line of code to read the data. 2. Provide an interpretation of the results For the toolbar, press ALT+F10 (PC) or ALT+FN+F10 (Mac) TTT Paragraph , Arial 3(12pt) '-.-. .,.. HTHL CS5 energy efficiency.converted (1).csw- Excel File Home Insert Page Layout Formulas Data Review View Developer Power Pivot T Tell me what you want to do... Calibri Wrap Text Merge & Center . Clipboard Alignment 1 relative_ compactness surface area wall area roof area overall height orientation glazing, ar glazing, are heating load cooling load 514.5 514.5 294 110.25 short 294 110.25 short 4.5 294 110.25 short 294 110.25 short 563.5 318.5 122.5 short 0.9563.5318.5122.5 short 563.5 318.5122.5 short 563.5318.5122.5short 147 short 147 short 147 short 147 short uniform 15.55 21.33 015.55 21.33 15.55 21.33 O15.55 21.33 O 20.84 28.28 021.46 25.38 020.7125.16 19.68 29.6 east 514.5 uniform 19.9521.97 19.34 23.49 18.31 27.87 1 23.77 17.41 21.46 6.9521.16 5.9824.93 28.52 37.73 29.9 31.27 east 588 294 612.5318.5 612.5318.5 612.5318.5 612.5318.5 147 short 147 short 147 short 147 short 147 short 147 short 147 short 661.5 416.5122.5 short 661.5416.5122.5 short 16.5 122.5 short 661.5416.5122.5 short 9.6330.93 637 343 28.75 39.44 24.7729.79 23.9329.68 24.7729.79 uniform 661.5416.S 220.5 tall Use the file energy efficiency converted.csy for this question. The column names are self-explanatory. The data set consists of information about several buildings. It shows different characteristics of each building and the building's heating and cooling load Read the data into a data frame called ee. 1. Write R code using ggplot to generate a histogram of heating load have 15 bins instead of the default 30. Adjust the plot so that the tick mark on the axis showing the count are spaced at intervals of 50. You need not show the line of code to read the data. 2. Provide an interpretation of the results For the toolbar, press ALT+F10 (PC) or ALT+FN+F10 (Mac) TTT Paragraph , Arial 3(12pt) '-.-. .,.. HTHL CS5