Write code for the Following problem in Java GUI

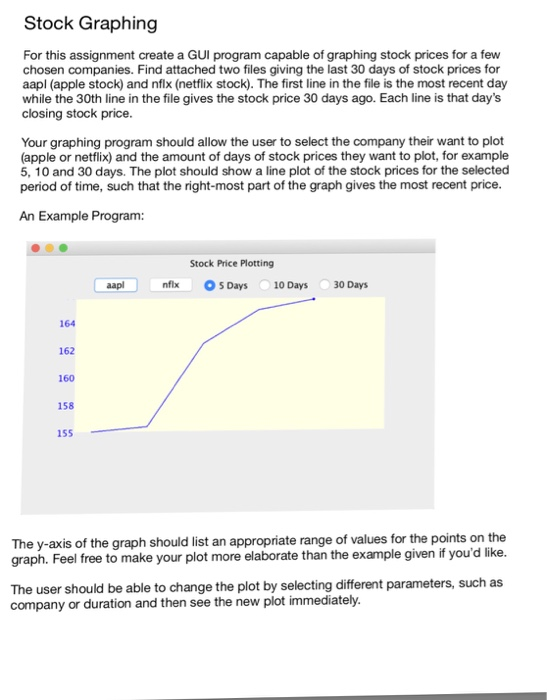
Stock Graphing For this assignment create a GUl program capable of graphing stock prices for a few chosen companies. Find attached two files giving the last 30 days of stock prices for aapl (apple stock) and nflx (netflix stock). The first line in the file is the most recent day while the 30th line in the file gives the stock price 30 days ago. Each line is that day's closing stock price. Your graphing program should allow the user to select the company their want to plot (apple or netflix) and the amount of days of stock prices they want to plot, for example 5, 10 and 30 days. The plot should show a line plot of the stock prices for the selected period of time, such that the right-most part of the graph gives the most recent price. An Example Program: Stock Price Plotting aapl nfix Os Days 10 Days 30 Days 164 162 160 158 155 The y-axis of the graph should list an appropriate range of values for the points on the graph. Feel free to make your plot more elaborate than the example given if you'd like. The user should be able to change the plot by selecting different parameters, such as company or duration and then see the new plot immediately. Stock Graphing For this assignment create a GUl program capable of graphing stock prices for a few chosen companies. Find attached two files giving the last 30 days of stock prices for aapl (apple stock) and nflx (netflix stock). The first line in the file is the most recent day while the 30th line in the file gives the stock price 30 days ago. Each line is that day's closing stock price. Your graphing program should allow the user to select the company their want to plot (apple or netflix) and the amount of days of stock prices they want to plot, for example 5, 10 and 30 days. The plot should show a line plot of the stock prices for the selected period of time, such that the right-most part of the graph gives the most recent price. An Example Program: Stock Price Plotting aapl nfix Os Days 10 Days 30 Days 164 162 160 158 155 The y-axis of the graph should list an appropriate range of values for the points on the graph. Feel free to make your plot more elaborate than the example given if you'd like. The user should be able to change the plot by selecting different parameters, such as company or duration and then see the new plot immediately


