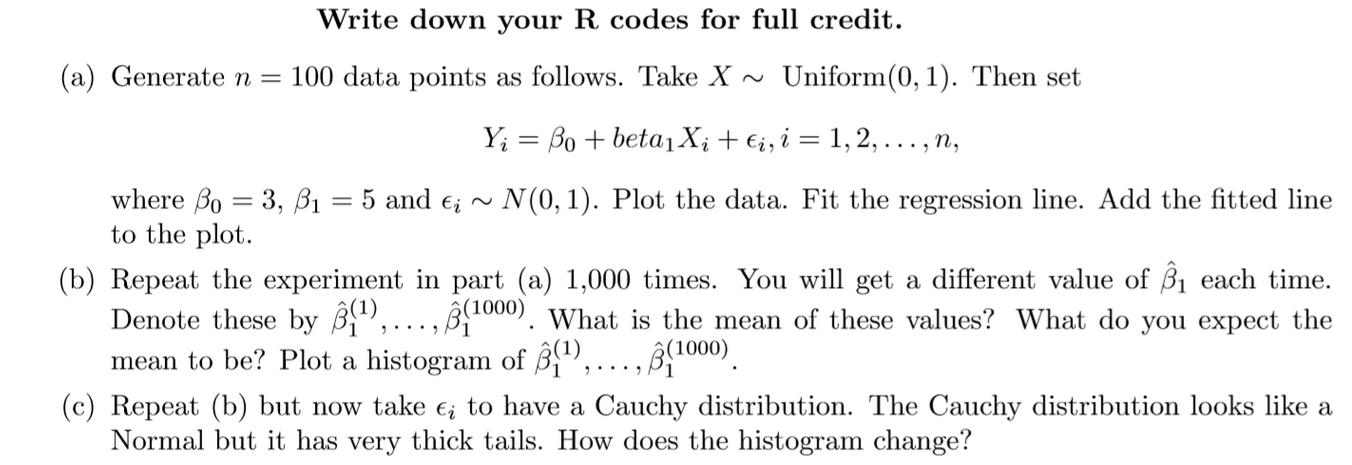
Question: Write down your R codes for full credit. Uniform(0, 1). Then set (a) Generate n = 100 data points as follows. Take X Yi

Write down your R codes for full credit. Uniform(0, 1). Then set (a) Generate n = 100 data points as follows. Take X Yi Bo + beta X + i, i = 1, 2,..., n, = where Bo = 3, B = 5 and ; ~ N(0, 1). Plot the data. Fit the regression line. Add the fitted line to the plot. (b) Repeat the experiment in part (a) 1,000 times. You will get a different value of 3 each time. Denote these by (), ),..., (1000). What is the mean of these values? What do you expect the mean to be? Plot a histogram of 3(), (1000) (c) Repeat (b) but now take e; to have a Cauchy distribution. The Cauchy distribution looks like a Normal but it has very thick tails. How does the histogram change?
Step by Step Solution
3.44 Rating (151 Votes )
There are 3 Steps involved in it
a To generate 100 da... View full answer

Get step-by-step solutions from verified subject matter experts


