Write formulas/make predictions - just the yellow boxes below. Thank you - Will upvote!
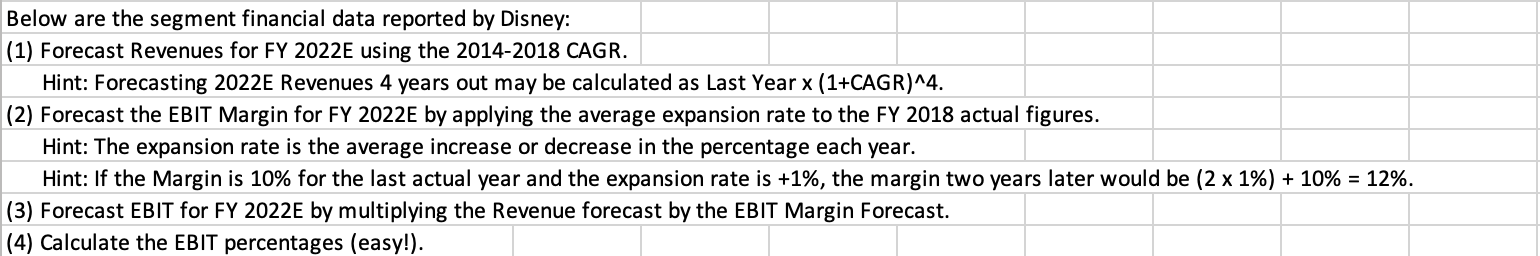
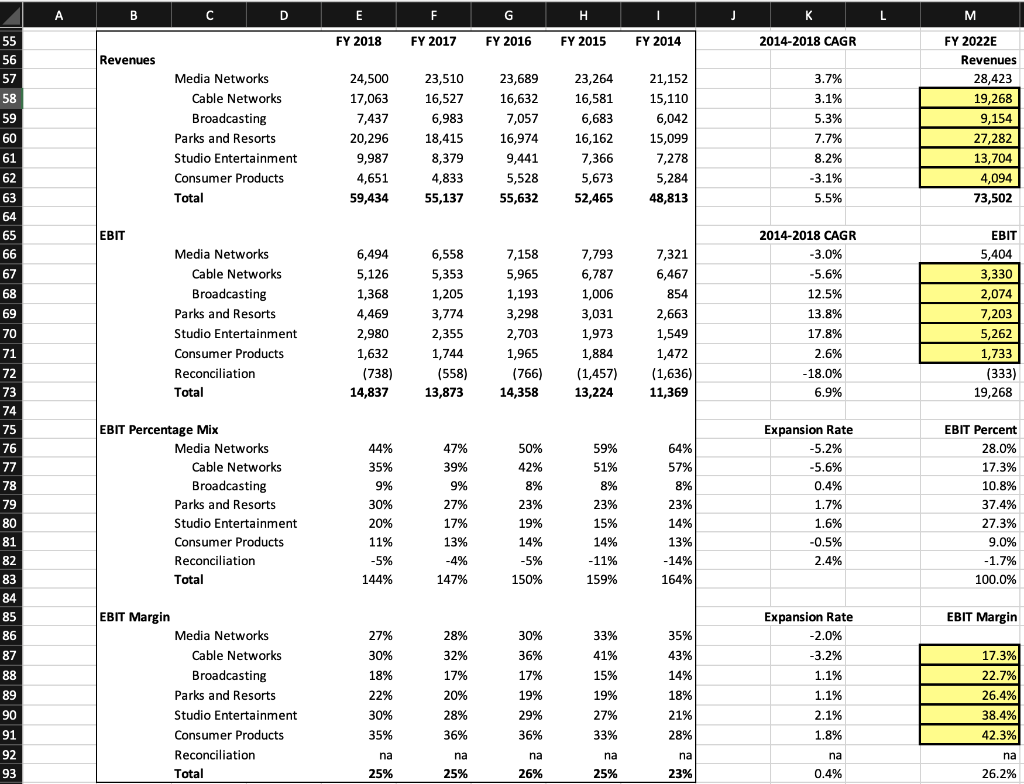
Below are the segment financial data reported by Disney: (1) Forecast Revenues for FY 2022E using the 2014-2018 CAGR. Hint: Forecasting 2022E Revenues 4 years out may be calculated as Last Year x (1+CAGR)^4. (2) Forecast the EBIT Margin for FY 2022E by applying the average expansion rate to the FY 2018 actual figures. Hint: The expansion rate is the average increase or decrease in the percentage each year. Hint: If the Margin is 10% for the last actual year and the expansion rate is +1%, the margin two years later would be (2 x 1%) + 10% = 12%. (3) Forecast EBIT for FY 2022E by multiplying the Revenue forecast by the EBIT Margin Forecast. (4) Calculate the EBIT percentages (easy!). A B D F G H J E FY 2018 FY 2017 FY 2016 FY 2015 FY 2014 2014-2018 CAGR Revenues Media Networks Cable Networks Broadcasting Parks and Resorts Studio Entertainment Consumer Products Total 24,500 17,063 7,437 20,296 9,987 4,651 59,434 23,510 16,527 6,983 18,415 8,379 4,833 55,137 23,689 16,632 7,057 16,974 9,441 5,528 55,632 23,264 16,581 6,683 16,162 7,366 5,673 52,465 21,152 15,110 6,042 15,099 7,278 5,284 48,813 3.7% 3.1% 5.3% 7.7% 8.2% -3.1% 5.5% M FY 2022E Revenues 28,423 19,268 9,154 27,282 13,704 4,094 73,502 EBIT Media Networks Cable Networks Broadcasting Parks and Resorts Studio Entertainment Consumer Products Reconciliation Total 6,494 5,126 1,368 4,469 2,980 1,632 (738) 14,837 6,558 5,353 1,205 3,774 2,355 1,744 (558) 13,873 7,158 5,965 1,193 3,298 2,703 1,965 (766) 14,358 7,793 6,787 1,006 3,031 1,973 1,884 (1,457) 13,224 7,321 6,467 854 2,663 1,549 1,472 (1,636) 11,369 2014-2018 CAGR -3.0% % -5.6% 12.5% 13.8% 17.8% 2.6% -18.0% 6.9% EBIT 5,404 3,330 2,074 7,203 5,262 1,733 (333) 19,268 55 56 57 58 59 60 61 62 63 64 65 66 67 68 69 70 71 72 73 74 75 76 77 78 79 80 81 82 83 84 85 86 87 88 89 90 91 92 93 44% 64% EBIT Percentage Mix Media Networks Cable Networks Broadcasting Parks and Resorts Studio Entertainment Consumer Products Reconciliation Total 47% 39% 9% 27% 17% 13% -4% 50% 42% 8% 23% 35% 9% 30% 20% 11% -5% 144% 59% 51% 8% 23% 15% 14% -11% 159% Expansion Rate -5.2% -5.6% 0.4% 1.7% 1.6% -0.5% 2.4% 57% 8% 23% 14% 13% -14% 164% EBIT Percent 28.0% 17.3% 10.8% 37.4% 27.3% 9.0% -1.7% 100.0% 19% 14% -5% 150% 147% EBIT Margin 30% 33% Expansion Rate -2.0% -3.2% 36% 1.1% EBIT Margin Media Networks Cable Networks Broadcasting Parks and Resorts Studio Entertainment Consumer Products Reconciliation Total 27% 30% 18% 22% 30% 35% 28% 32% 17% 20% 28% 36% 17% 19% 29% 36% 41% 15% 19% 27% 33% 35% 43% 14% 18% 21% 28% 1.1% 2.1% 1.8% 17.3% 22.7% 26.4% 38.4% 42.3% na na na 25% na 25% na 26% na 0.4% na 26.2% 25% 23%