

Answered step by step
Verified Expert Solution
Question
1 Approved Answer
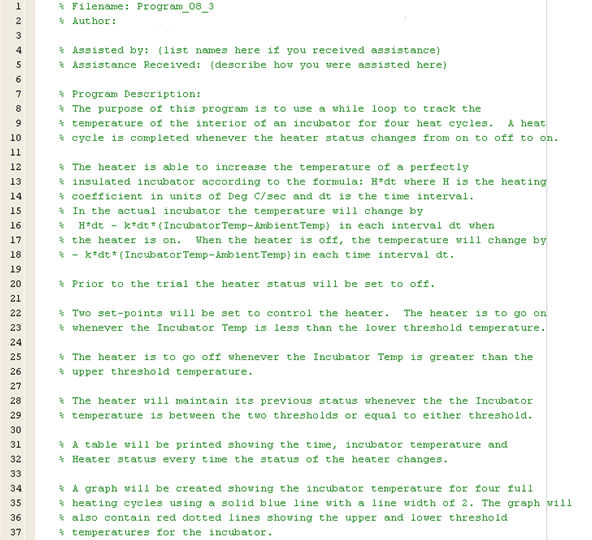
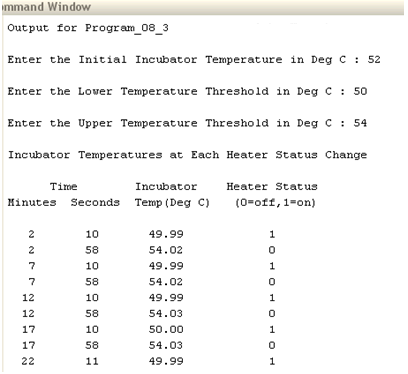
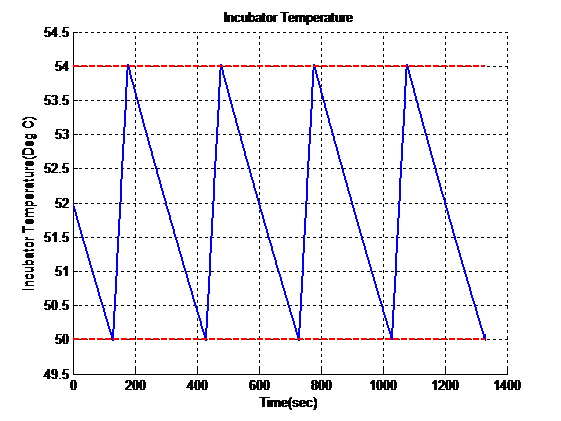
Write Matlab Program as decription followed and the output show as below. There are four heating and cooling coefficients. K = 5e-4 H = 0.1
Write Matlab Program as decription followed and the output show as below.
There are four heating and cooling coefficients.
K = 5e-4
H = 0.1
AmbientTemp =20
dTime = 1
Step by Step Solution
There are 3 Steps involved in it
Step: 1

Get Instant Access to Expert-Tailored Solutions
See step-by-step solutions with expert insights and AI powered tools for academic success
Step: 2

Step: 3
Ace Your Homework with AI
Get the answers you need in no time with our AI-driven, step-by-step assistance
Get Started
Genetic Databases
Authors: Martin J. Bishop
1st Edition
0121016250, 978-0121016258