

Question
Write R code that will create the Bayesian network shown below. Include your code and output (e.g., a screenshot of a plot) that shows the
Write R code that will create the Bayesian network shown below. Include your code and output (e.g., a screenshot of a plot) that shows the Bayesian network graph and the contents of each nodes probability table. Then write R code that uses the Bayesian network to predict Quality for the following 2 instances: (i) Location = Good, Quality = Normal, Cost = High, No. of People = Low, and (ii) Location = Bad, Quality = Good, Cost = Low, No. of People = High; include output (e.g., a screenshot) that shows the results of those predictions as a confusion matrix.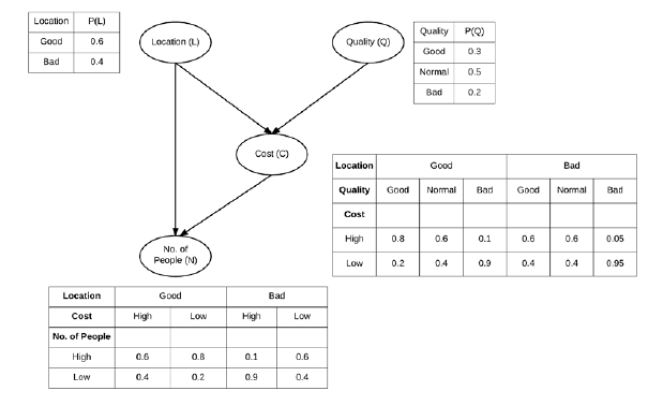
Step by Step Solution
There are 3 Steps involved in it
Step: 1

Get Instant Access to Expert-Tailored Solutions
See step-by-step solutions with expert insights and AI powered tools for academic success
Step: 2

Step: 3
Ace Your Homework with AI
Get the answers you need in no time with our AI-driven, step-by-step assistance
Get Started
Database Concepts
Authors: David M Kroenke, David J Auer
6th Edition
0132742926, 978-0132742924