

Answered step by step
Verified Expert Solution
Question
1 Approved Answer
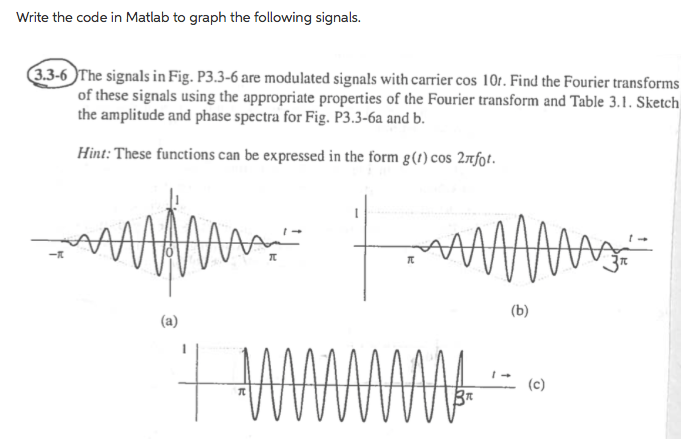
Write the code in Matlab to graph the following signals. (The signals in Fig. P3.3-6 are modulated signals with carrier cos 10t. Find the Fourier
Step by Step Solution
There are 3 Steps involved in it
Step: 1

Get Instant Access to Expert-Tailored Solutions
See step-by-step solutions with expert insights and AI powered tools for academic success
Step: 2

Step: 3
Ace Your Homework with AI
Get the answers you need in no time with our AI-driven, step-by-step assistance
Get Started
Oracle Database Foundations Technology Fundamentals For IT Success
Authors: Bob Bryla
1st Edition
0782143725, 9780782143720