Answered step by step
Verified Expert Solution
Link Copied!

Question

1 Approved Answer

Write the formula and answer. A survey was carried out on ACE TV's English news. The table below shows the number of audiences according to

Write the formula and answer.

image text in transcribed
A survey was carried out on ACE TV's English news. The table below shows the number of audiences according to age (in years) who watch ACE TV's English news. Age (years) Frequency 10-19 A 30 20-29 78 30-39 ' 90 40-49 , 34 50-59 12 60-69 6 (a) Plot a histogram for the data above [4 marks] (b) Construct a cumulative frequency distribution table consisting of the [2 marks] class interval, upper boundary and cumulative frequency from the information given. (c) Plot an ogive from the result (4] (b) above. [4 marks]

Step by Step Solution

There are 3 Steps involved in it

Step: 1

blur-text-image

Get Instant Access to Expert-Tailored Solutions

See step-by-step solutions with expert insights and AI powered tools for academic success

Step: 2

blur-text-image

Step: 3

blur-text-image

Ace Your Homework with AI

Get the answers you need in no time with our AI-driven, step-by-step assistance

Get Started

Recommended Textbook for

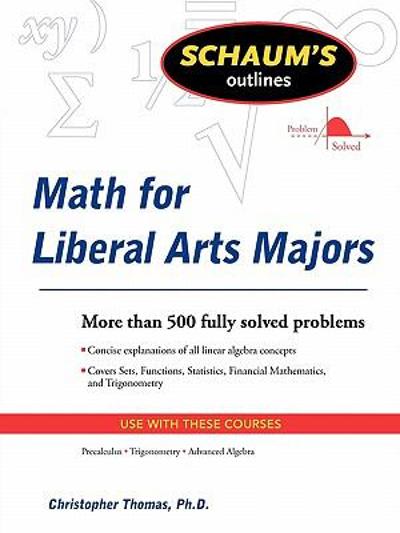
Mathematics For Liberal Arts Majors

Authors: Christopher Thomas

1st Edition

0071544305, 9780071544306

More Books

Students also viewed these Mathematics questions