Answered step by step
Verified Expert Solution
Question
1 Approved Answer
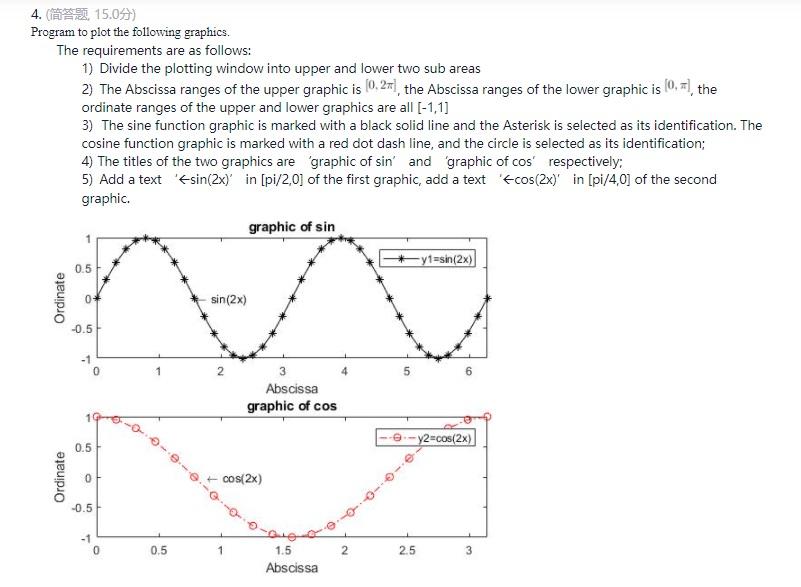
write the Matlab codes for the following. 4. 15.0) Program to plot the following graphics. The requirements are as follows: 1) Divide the plotting window
write the Matlab codes for the following.

4. 15.0) Program to plot the following graphics. The requirements are as follows: 1) Divide the plotting window into upper and lower two sub areas 2) The Abscissa ranges of the upper graphic is 0,261, the Abscissa ranges of the lower graphic is 10, 71, the ordinate ranges of the upper and lower graphics are all (-1,1] 3) The sine function graphic is marked with a black solid line and the Asterisk is selected as its identification. The cosine function graphic is marked with a red dot dash line, and the circle is selected as its identification; 4) The titles of the two graphics are graphic of sin' and 'graphic of cos' respectively: 5) Add a text'+sin(2x) in (pi/2,0] of the first graphic, add a text '*cos(2x)' in [pi/4,0] of the second graphic graphic of sin -y1=sin(2x) 0.5 Ordinate 0 sin(2x) -0.5 2 5 6 3 Abscissa graphic of cos 99 y2-cos(2x) 0.5 @e Ordinate cos(2x) -0.5 ---- -1 0 0.5 1 2 2.5 3 1.5 Abscissa
Step by Step Solution
There are 3 Steps involved in it
Step: 1

Get Instant Access to Expert-Tailored Solutions
See step-by-step solutions with expert insights and AI powered tools for academic success
Step: 2

Step: 3

Ace Your Homework with AI
Get the answers you need in no time with our AI-driven, step-by-step assistance
Get Started


