Question
Write your own functions in R to do the following: myAvg { compute average return average } mySD { compute Std Dev return Std Dev
Write your own functions in R to do the following:
myAvg
{ compute average return average }
mySD
{ compute Std Dev return Std Dev }
myRange
{ compute Range, calculated as Max - Min return Range }
Read the CardioGoodnessFit.csv file and apply these functions to the last two columns Income and Miles.
The output should look like the following:
Income (Average, SD, Range): 53719.58, 16506.68, 75019
Miles (Average, SD, Range): 103.19, 51.86, 339\
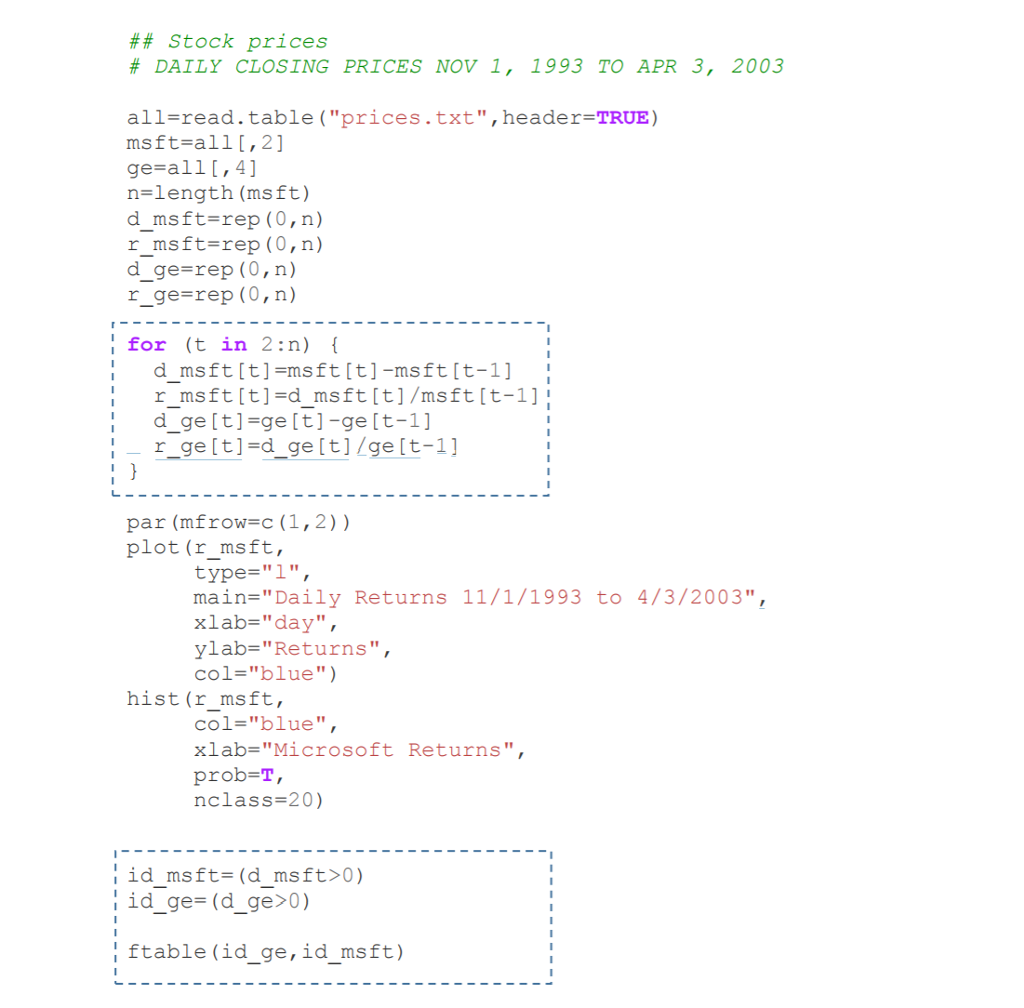
Please comment the portions in the enclosed boxes in the following program. Please make sure that you explain the meaning and relevance of all variables in the enclosed boxes.

Step by Step Solution
There are 3 Steps involved in it
Step: 1

Get Instant Access to Expert-Tailored Solutions
See step-by-step solutions with expert insights and AI powered tools for academic success
Step: 2

Step: 3

Ace Your Homework with AI
Get the answers you need in no time with our AI-driven, step-by-step assistance
Get Started


