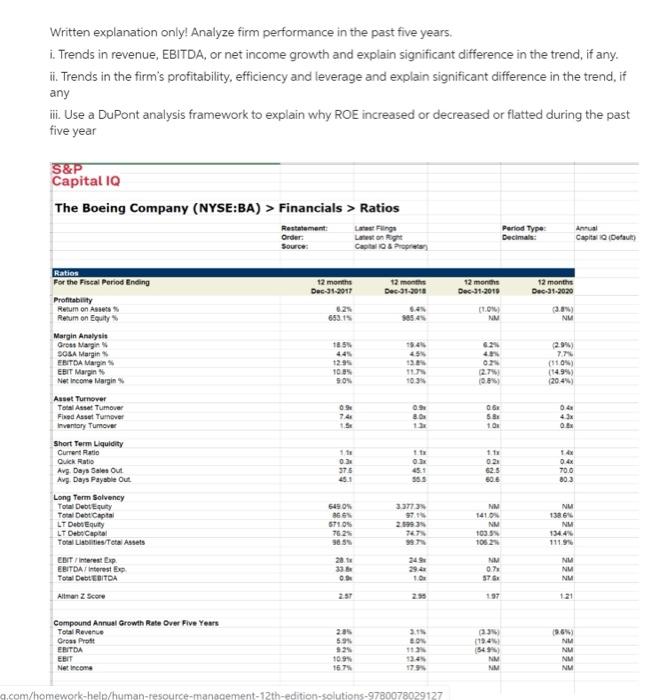
Written explanation only! Analyze firm performance in the past five years. i. Trends in revenue, EBITDA, or net income growth and explain significant difference in the trend, if any. ii. Trends in the firm's profitability, efficiency and leverage and explain significant difference in the trend, if any ii. Use a DuPont analysis framework to explain why ROE increased or decreased or flatted during the past five year S&P Capital 10 The Boeing Company (NYSE:BA) > Financials > Ratios Restatement: Les Finge Order: non Source Cars Period Type Decimals Annual Capital Out 12 months Dec-31-2017 6.25 653.15 12 months Dec 01-2018 5. 12 months Dec-31-2020 12 months Dec-31-2010 (1.00 NM 3.3) NU 15.4 45 15 4.45 12.95 TOS 50 4 ON 27 2.9) 7 (110) (149) 20.4%) 117 0.6 OS 741 04 43 13 1 Raties For the Fiscal Period Ending Profitability Retum on Assets Rerum on Equity Margin Analysis Gross Margin SOSA Margin EBITOA Margins EBIT Margin Net Income Idargin Asset Turnover Total Asset Tumover Fixed Asset Turnover Inventory Tumover Short Term Liquidity Current Ratio Quick Ratio Avg. Daya Sales Out Avg Days Payable Out Long Term Solvency Total Debt Equity Total Debt Captai LT Debt Equity LT Debo Capital Total Labies/Total Assets EDIT/Interest Bap EBITDA Interest Exp Total Debt EBITDA Altman Score 11 110 02 375 It O. 651 555 021 62.5 50.6 TAX 0.4 700 803 549 a 67105 76.2 30.5 2.1993 NM 141 NM 103.5 1052 NU 1386 NM 134.4% 111 9971 2014 336 O. 29.4 10 NU 0.75 376 NM NU NM 257 197 121 2:35 594 Compound Annual Growth Rate Over Five Years Total Revenue Gross Prott EBITDA EBIT Net ir 19.45 (54 NM NM 11 125 (9.6 NU NU NM NU 10.9 1674 179 g.com/homework-help/human-resource anagement -solutions-9780078029127 Written explanation only! Analyze firm performance in the past five years. i. Trends in revenue, EBITDA, or net income growth and explain significant difference in the trend, if any. ii. Trends in the firm's profitability, efficiency and leverage and explain significant difference in the trend, if any ii. Use a DuPont analysis framework to explain why ROE increased or decreased or flatted during the past five year S&P Capital 10 The Boeing Company (NYSE:BA) > Financials > Ratios Restatement: Les Finge Order: non Source Cars Period Type Decimals Annual Capital Out 12 months Dec-31-2017 6.25 653.15 12 months Dec 01-2018 5. 12 months Dec-31-2020 12 months Dec-31-2010 (1.00 NM 3.3) NU 15.4 45 15 4.45 12.95 TOS 50 4 ON 27 2.9) 7 (110) (149) 20.4%) 117 0.6 OS 741 04 43 13 1 Raties For the Fiscal Period Ending Profitability Retum on Assets Rerum on Equity Margin Analysis Gross Margin SOSA Margin EBITOA Margins EBIT Margin Net Income Idargin Asset Turnover Total Asset Tumover Fixed Asset Turnover Inventory Tumover Short Term Liquidity Current Ratio Quick Ratio Avg. Daya Sales Out Avg Days Payable Out Long Term Solvency Total Debt Equity Total Debt Captai LT Debt Equity LT Debo Capital Total Labies/Total Assets EDIT/Interest Bap EBITDA Interest Exp Total Debt EBITDA Altman Score 11 110 02 375 It O. 651 555 021 62.5 50.6 TAX 0.4 700 803 549 a 67105 76.2 30.5 2.1993 NM 141 NM 103.5 1052 NU 1386 NM 134.4% 111 9971 2014 336 O. 29.4 10 NU 0.75 376 NM NU NM 257 197 121 2:35 594 Compound Annual Growth Rate Over Five Years Total Revenue Gross Prott EBITDA EBIT Net ir 19.45 (54 NM NM 11 125 (9.6 NU NU NM NU 10.9 1674 179 g.com/homework-help/human-resource anagement -solutions-9780078029127


