

Question
W&S Partners has just won the January 31, 2023, audit for Cloud 9. The audit team assigned to this client is: Partner, Jo Wadley Audit
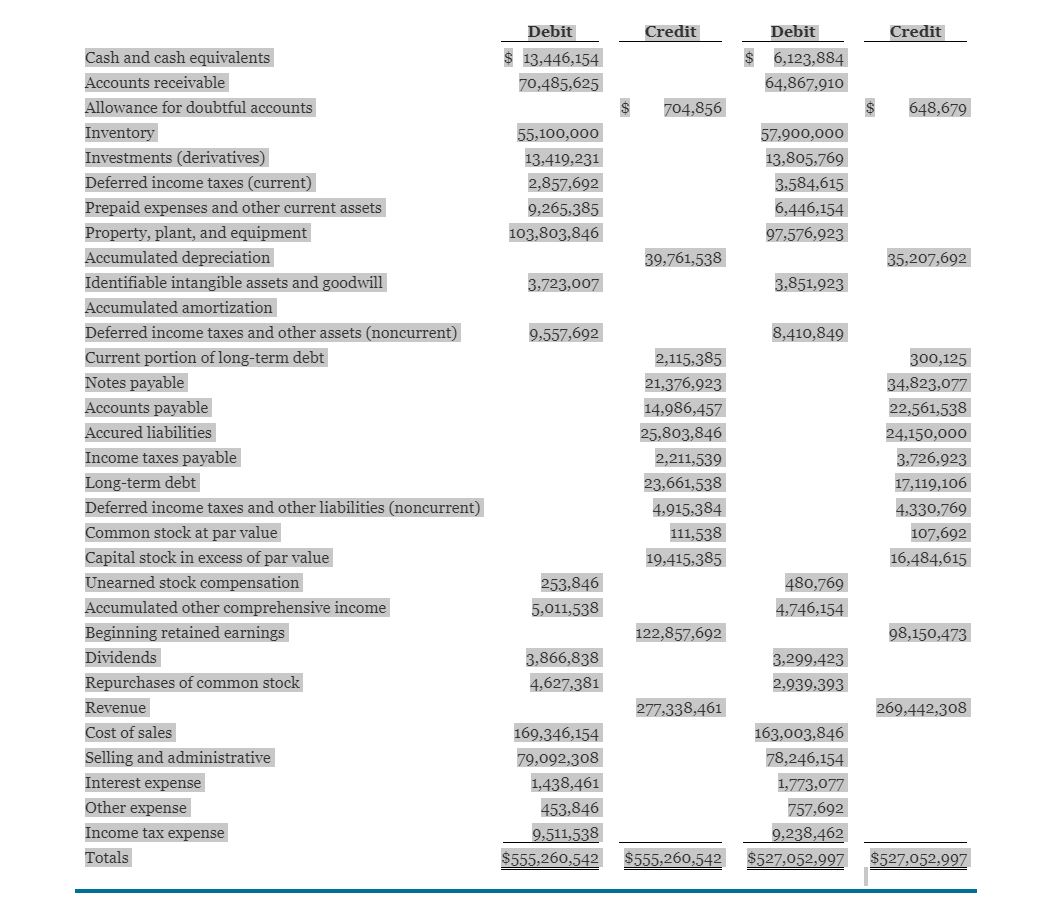
W&S Partners has just won the January 31, 2023, audit for Cloud 9. The audit team assigned to this client is: Partner, Jo Wadley Audit manager, Sharon Gallagher Audit senior, Josh Thomas IT audit manager, Mark Batten Experienced staff, Suzie Pickering First-year staff, Ian Harper As a part of the risk assessment phase for the new audit, the audit team needs to gain an understanding of Cloud 9s structure and its business environment, determine materiality, and assess the risk of material misstatement. This will assist the team in developing an audit strategy and designing the nature, extent, and timing of audit procedures. One task during the planning phase is to consider the concept of materiality as it applies to the client. Auditors will design procedures to identify and correct errors or irregularities that would have a material effect on the financial statements and affect the decision-making of the users of the financial statements. Materiality is used in determining audit procedures and sample selections, and evaluating differences from client records to audit results. Materiality is the maximum amount of misstatement, individually or in aggregate, that can be accepted in the financial statements. In selecting the benchmark to be used to calculate materiality, the auditors should consider the key drivers of the business. They should ask, What are the end users (that is, stockholders, banks, etc.) of the accounts going to be looking at? For example, will stockholders be interested in profit figures that can be used to pay dividends and increase share price? W&S Partners audit methodology dictates that one planning materiality (PM) amount is to be used for the financial statements as a whole. The benchmark selected for determining materiality is the one determined to be the key driver of the business. W&S Partners use the following percentages as starting points for the various benchmarks:
| Benchmark | Threshold (%) |
| Income before tax | 5.0 |
| Total revenue | 0.5 |
| Gross profit | 2.0 |
| Total assets | 0.5 |
| Equity | 1.0 |
These starting points can be increased or decreased by taking into account qualitative client factors, which could be: The nature of the clients business and industry (for example, rapidly changing, either through growth or downsizing, or an unstable environment). Whether the client is a public company (or subsidiary of) subject to regulations. The knowledge of or high risk of fraud. Typically, income before tax is used; however, it cannot be used if reporting a loss for the year or if profitability is not consistent. When calculating PM based on interim figures, it may be necessary to annualize the results. This allows the auditors to plan the audit properly based on an approximate projected year-end balance. Then, at year-end, the figure is adjusted, if necessary, to reflect the actual results.
A.) Using the October 31, 2022, trial balance (in the appendix to this text), calculate planning materiality and include the justification for the benchmark that you have used for your calculation.
B.) Discuss how the planning materiality would be used to determine performance materiality.
C.) If the planning materiality amount is subsequently increased or decreased later in the audit, how would that impact the audit?
Step by Step Solution
There are 3 Steps involved in it
Step: 1

Get Instant Access to Expert-Tailored Solutions
See step-by-step solutions with expert insights and AI powered tools for academic success
Step: 2

Step: 3
Ace Your Homework with AI
Get the answers you need in no time with our AI-driven, step-by-step assistance
Get Started
Internal Control And Internal Audit In Non Profit Organizations A Practical Model
Authors: Kamal Bayramov
1st Edition
6203464015, 978-6203464016