Answered step by step
Verified Expert Solution
Question
1 Approved Answer
x = [0 5 15 75 135 195 255 320]; y = [0 40.22 21.28 70.16 79.00 14.32 27.96 26.71]; figure hold on % allow
x = [0 5 15 75 135 195 255 320];
y = [0 40.22 21.28 70.16 79.00 14.32 27.96 26.71];
figure
hold on % allow all vectors to be plotted in same
% figure
plot (x, y,'blue -o ');
box on
ax = gca
ax.XAxis.LineWidth = 2;
ax.YAxis.LineWidth = 2;
xlabel('time(min)','fontweight','bold')
ylabel ('% of decoloration/ppm','fontweight','bold')
legend('% of Decolorization', 'fontweight','bold')
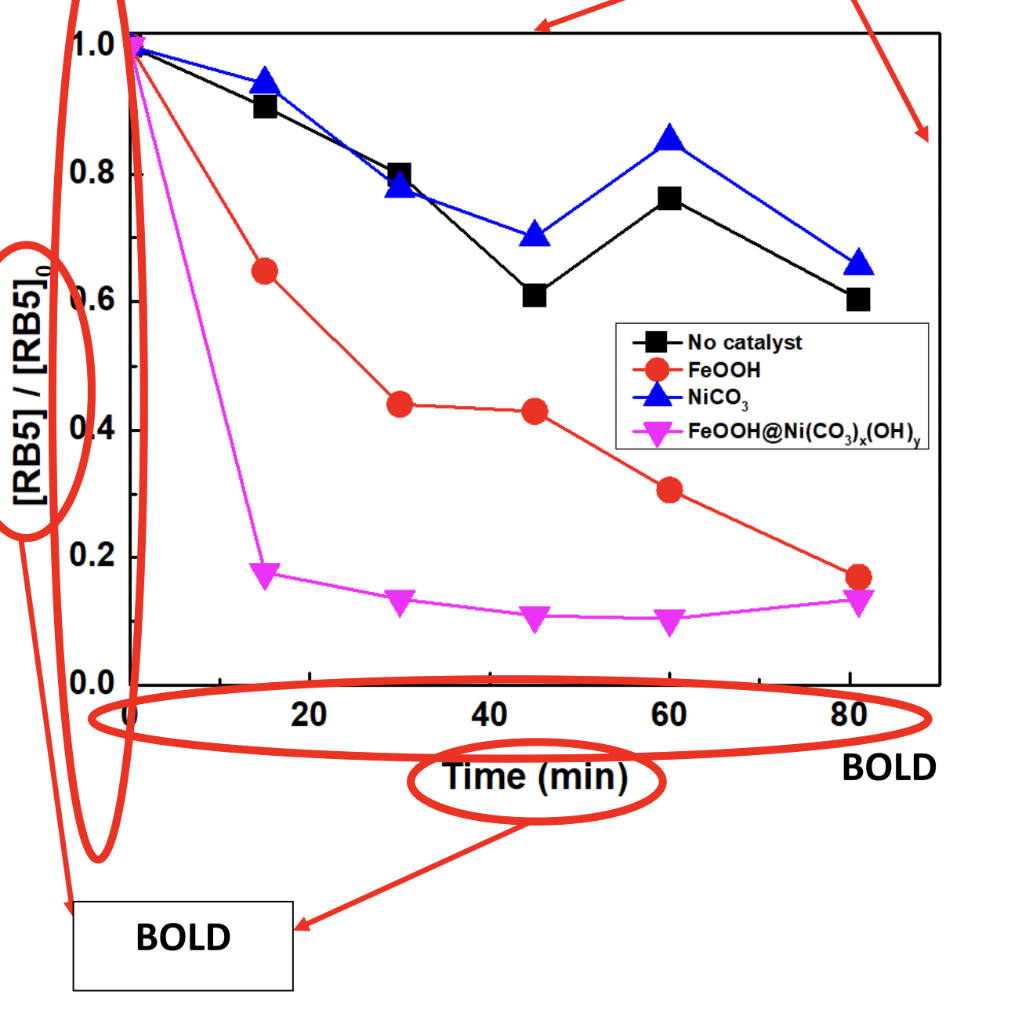
title( '1% concentration Similuated factory like RB5 wastewater') how to make the x and y values bold in matlab like on the image shown
Step by Step Solution
There are 3 Steps involved in it
Step: 1

Get Instant Access to Expert-Tailored Solutions
See step-by-step solutions with expert insights and AI powered tools for academic success
Step: 2

Step: 3

Ace Your Homework with AI
Get the answers you need in no time with our AI-driven, step-by-step assistance
Get Started


