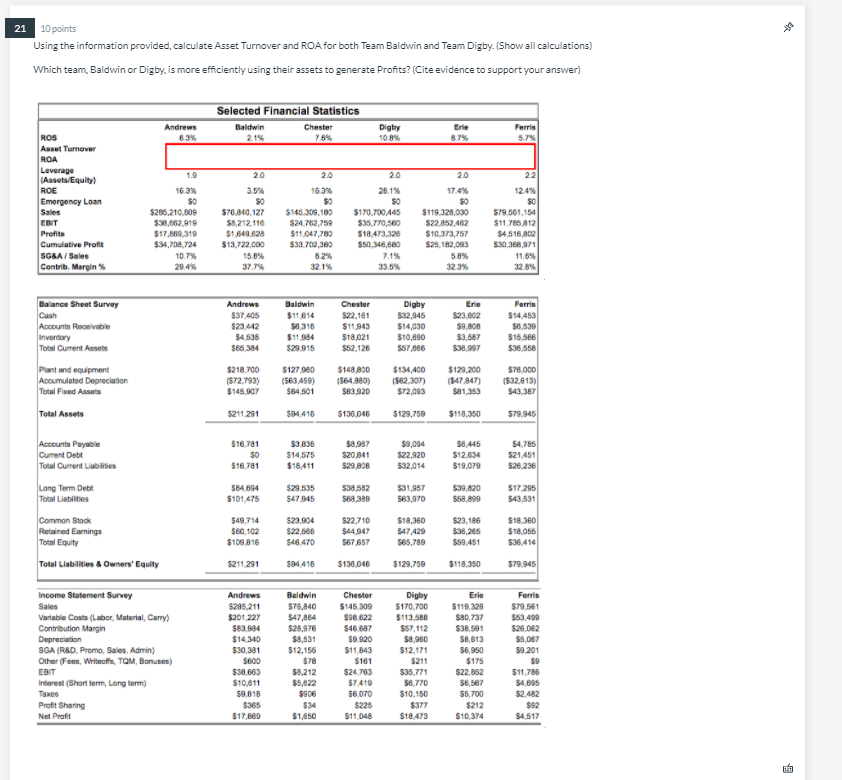
x 21 10 points Using the information provided, calculate Asset Turnover and ROA for both Team Baldwin and Team Digby. (Show all calculations) Which team, Baldwin or Digby. is more efficiently using their assets to generate Profits? (Cite evidence to support your answer) Selected Financial Statistics Baldwin Andrews 6.3% Chester 7.8% Digby 10.8% Erle 8.7% Ferris 5.7% 2.15 ROS Asset Turnover ROA 1.9 20 2.0 20 20 Leverage (Assets/Equity) ROE Emergency Loan Sales EBIT Profits Cumulative Profit 16.3% SO $265.210.009 $38,662,919 $17,869,319 $34,708.724 10.7% 29.4% 3.5% 50 $76,840,127 $8.212.116 $1849,628 $13,722.000 15.8% 37.7% 16.3% $0 $145,309,100 $24.762,759 $11,047,780 $33,702,380 28.15 SO $170.700 445 $35,770,560 $18.473,326 $50,346,680 17.4% SO $119.328,000 $22,852,462 $10,373,757 $25,182,083 22 12.4% SO $79.561.154 $11.785 812 $4.516,802 $30 368,971 11.6% 32.8% SGSA / Sales 7.1% 8.2% 32.1% 5.8% 323% Contrib. Margin% Andrews Baldwin Chester Erie Balance Sheet Survey Cash Accounts Receivable Inventory Total Current Assets $37 405 $23.442 $4,538 585,384 $11 614 $6316 $11.984 $29.915 $22,161 $11943 $18.021 552,126 Digby $32,945 $14,030 $10,690 557666 $23,602 $9,808 $3,587 $36.997 Ferris $14.453 $8.530 $15.566 $36.558 plant and equipment Accumulated Depreciation Total Fixed Assets $218.700 (572,793) $145,907 $127980 (563,450) $64 501 $148,800 (564,880) $83.920 $134.400 (562,307) $72,093 $129.200 (547 847) $81,353 $78,000 (532,613) $43,387 Total Assets $211 291 594416 $136,046 $129.750 $118,350 $79.945 $18,781 $3,836 Accounts Payable Current Debt Total Current Liabilities SO $16,781 $14575 $18,411 $8,987 $20,841 $29,808 59,094 $22.920 $32,014 $8.445 $12.634 $19,079 $4,785 $21.451 526.236 Long Term Debe Total Liabilities 584694 5101,475 $29.535 $47945 $38.582 568,380 $31,957 563,970 $39,820 $58,899 $17.285 $43.531 Common Stock Retained Earnings Total Equity $49,714 $60,102 $109,816 523.904 $22566 546470 $22,710 $44.947 567,657 $18,360 S47429 565,789 $23,186 $38,265 $59.451 $18,360 $18.055 $36.414 Total Liabilities & Owners' Equity $211.291 594416 $136,046 $129,750 $118,350 $79.945 Andrews Baldwin Income Statement Survey Sales Variable Costs Labor, Material, Carry) Contribution Margin Depreciation SGA (R&D Promo, Sales, Admin) Other (Fees, Writeos, TOM, Bonuses) EBIT $285.211 $201.227 $83.004 $14,340 $30,381 5600 $38.663 $10,811 59.818 $365 $17.689 $78,840 $47.864 528,976 $8,531 $12,156 sya $8.212 $5,822 5906 $34 $1,850 Chester $145.309 $98.622 S46607 $9.920 $11.843 $161 $24.763 57 410 56.070 $225 $11048 Digby $170,700 $113,588 $57,112 $8,960 $12.171 $211 $35,771 $8,770 $10,150 Erie $119,328 $80.737 $38.591 $8,613 $6,950 $175 $22,652 56,567 $5.700 $212 $10,374 Ferris $79,561 $53,490 $26.062 $5,067 $9.201 $9 $11.786 $4,695 52.482 $92 $4,517 Interest (Short term Long term) Taxes Profit Sharing Net Profit $377 $18.473


