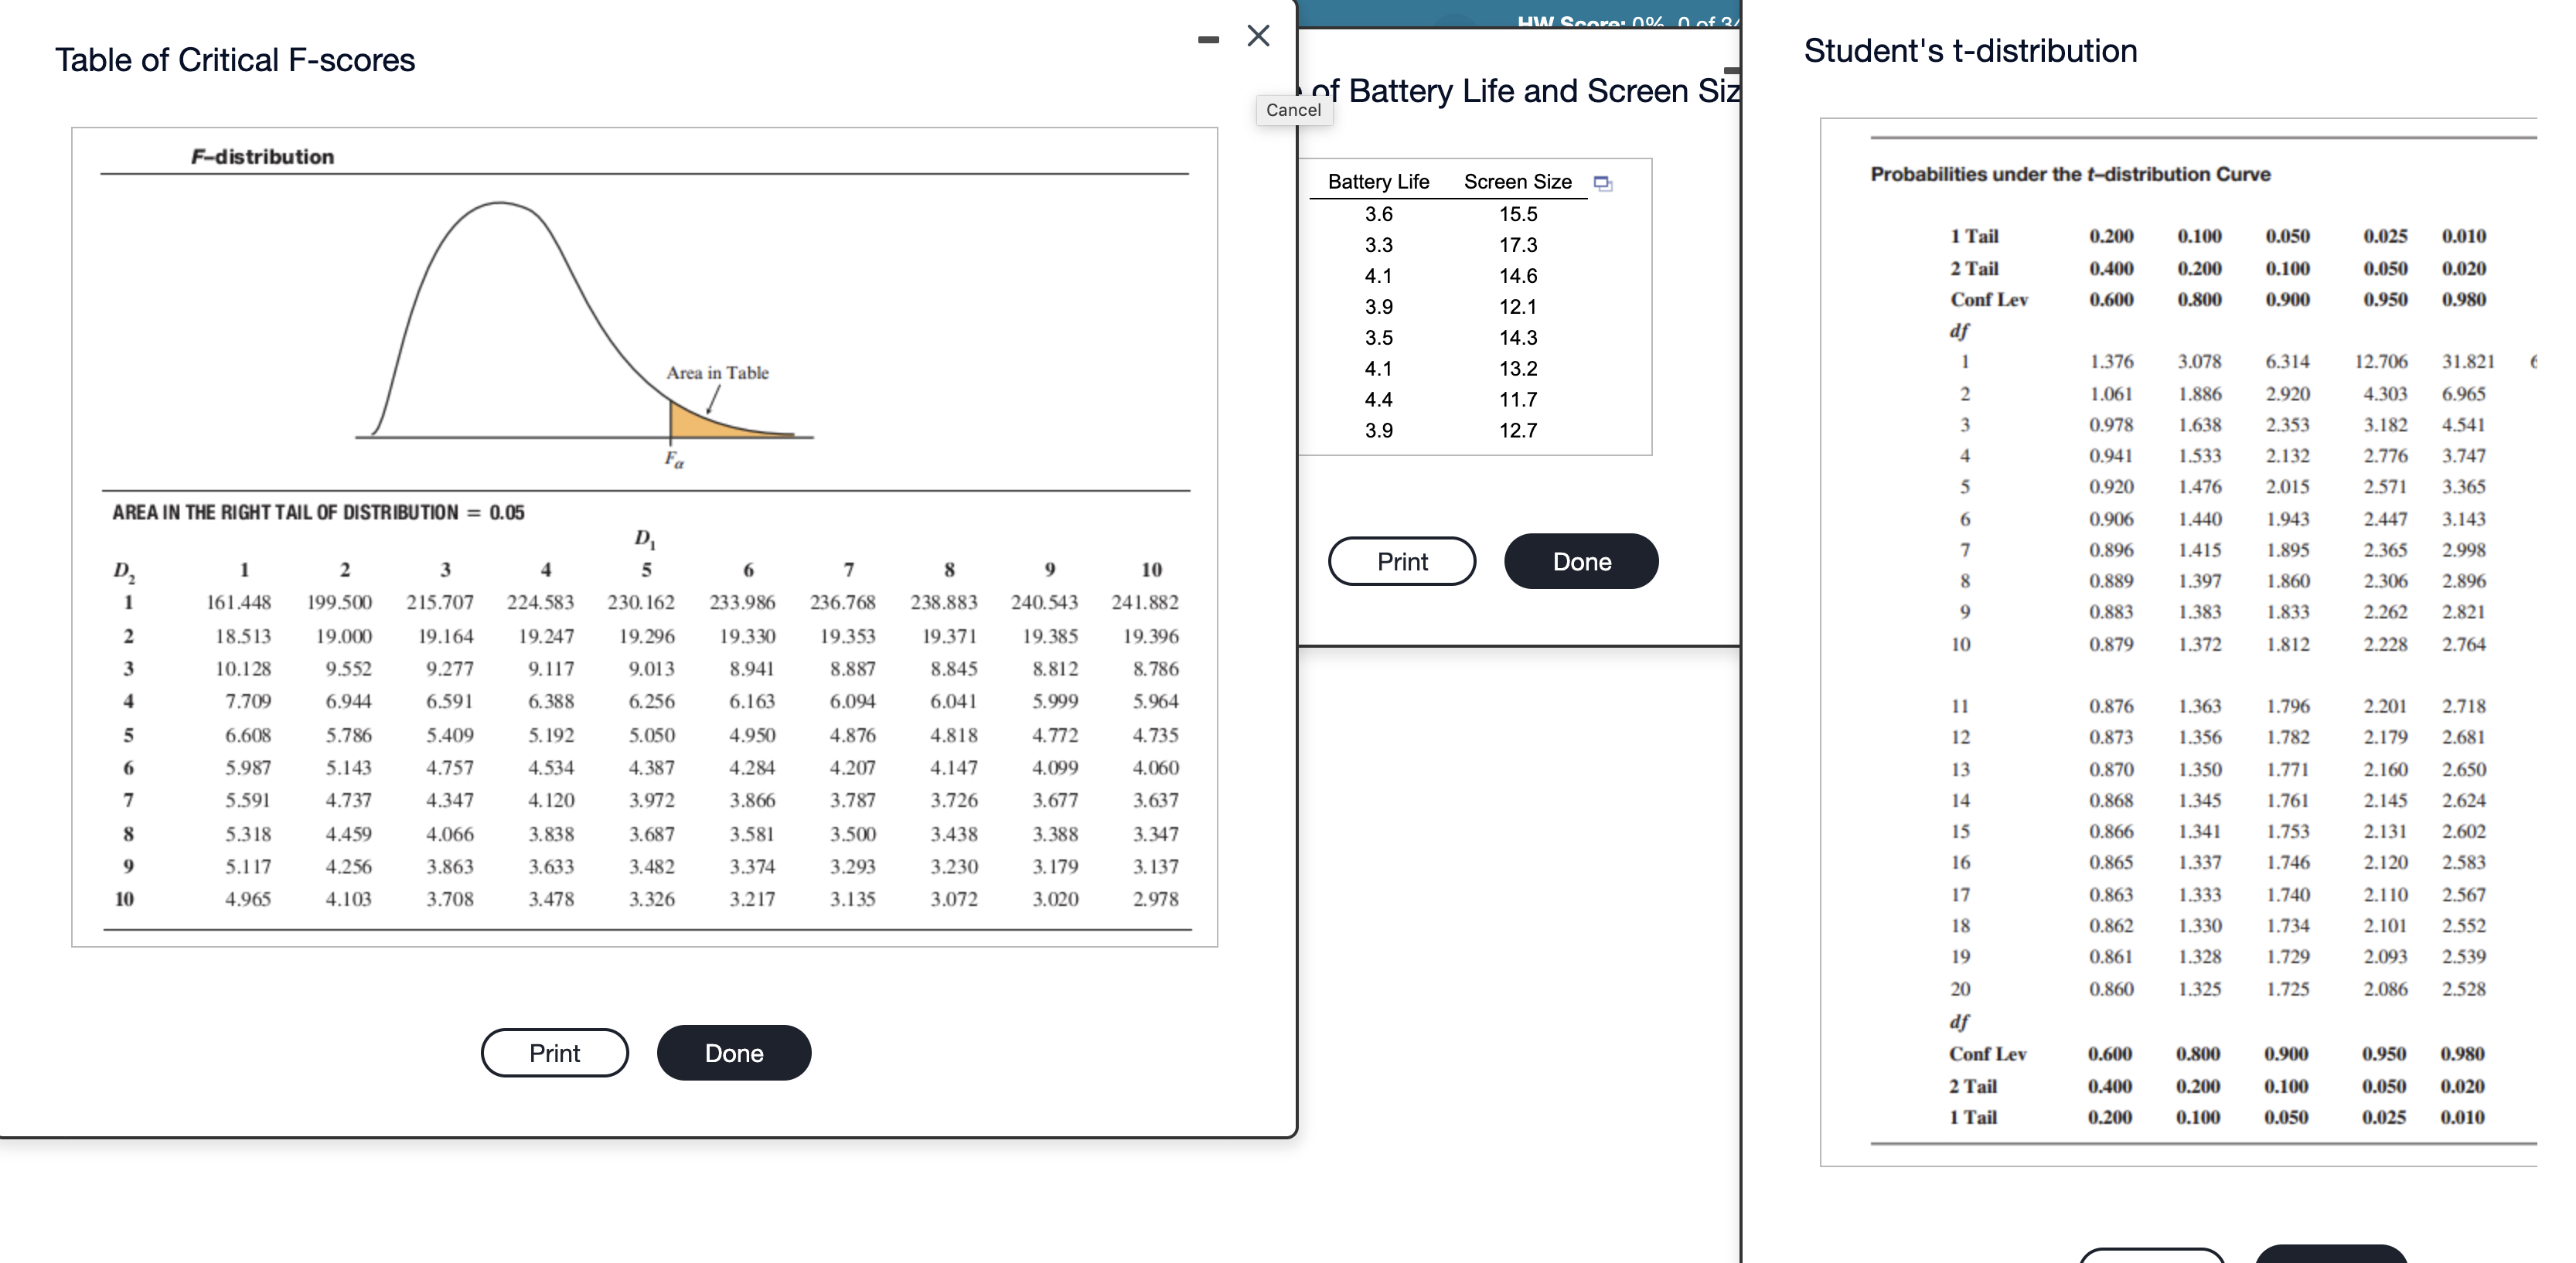
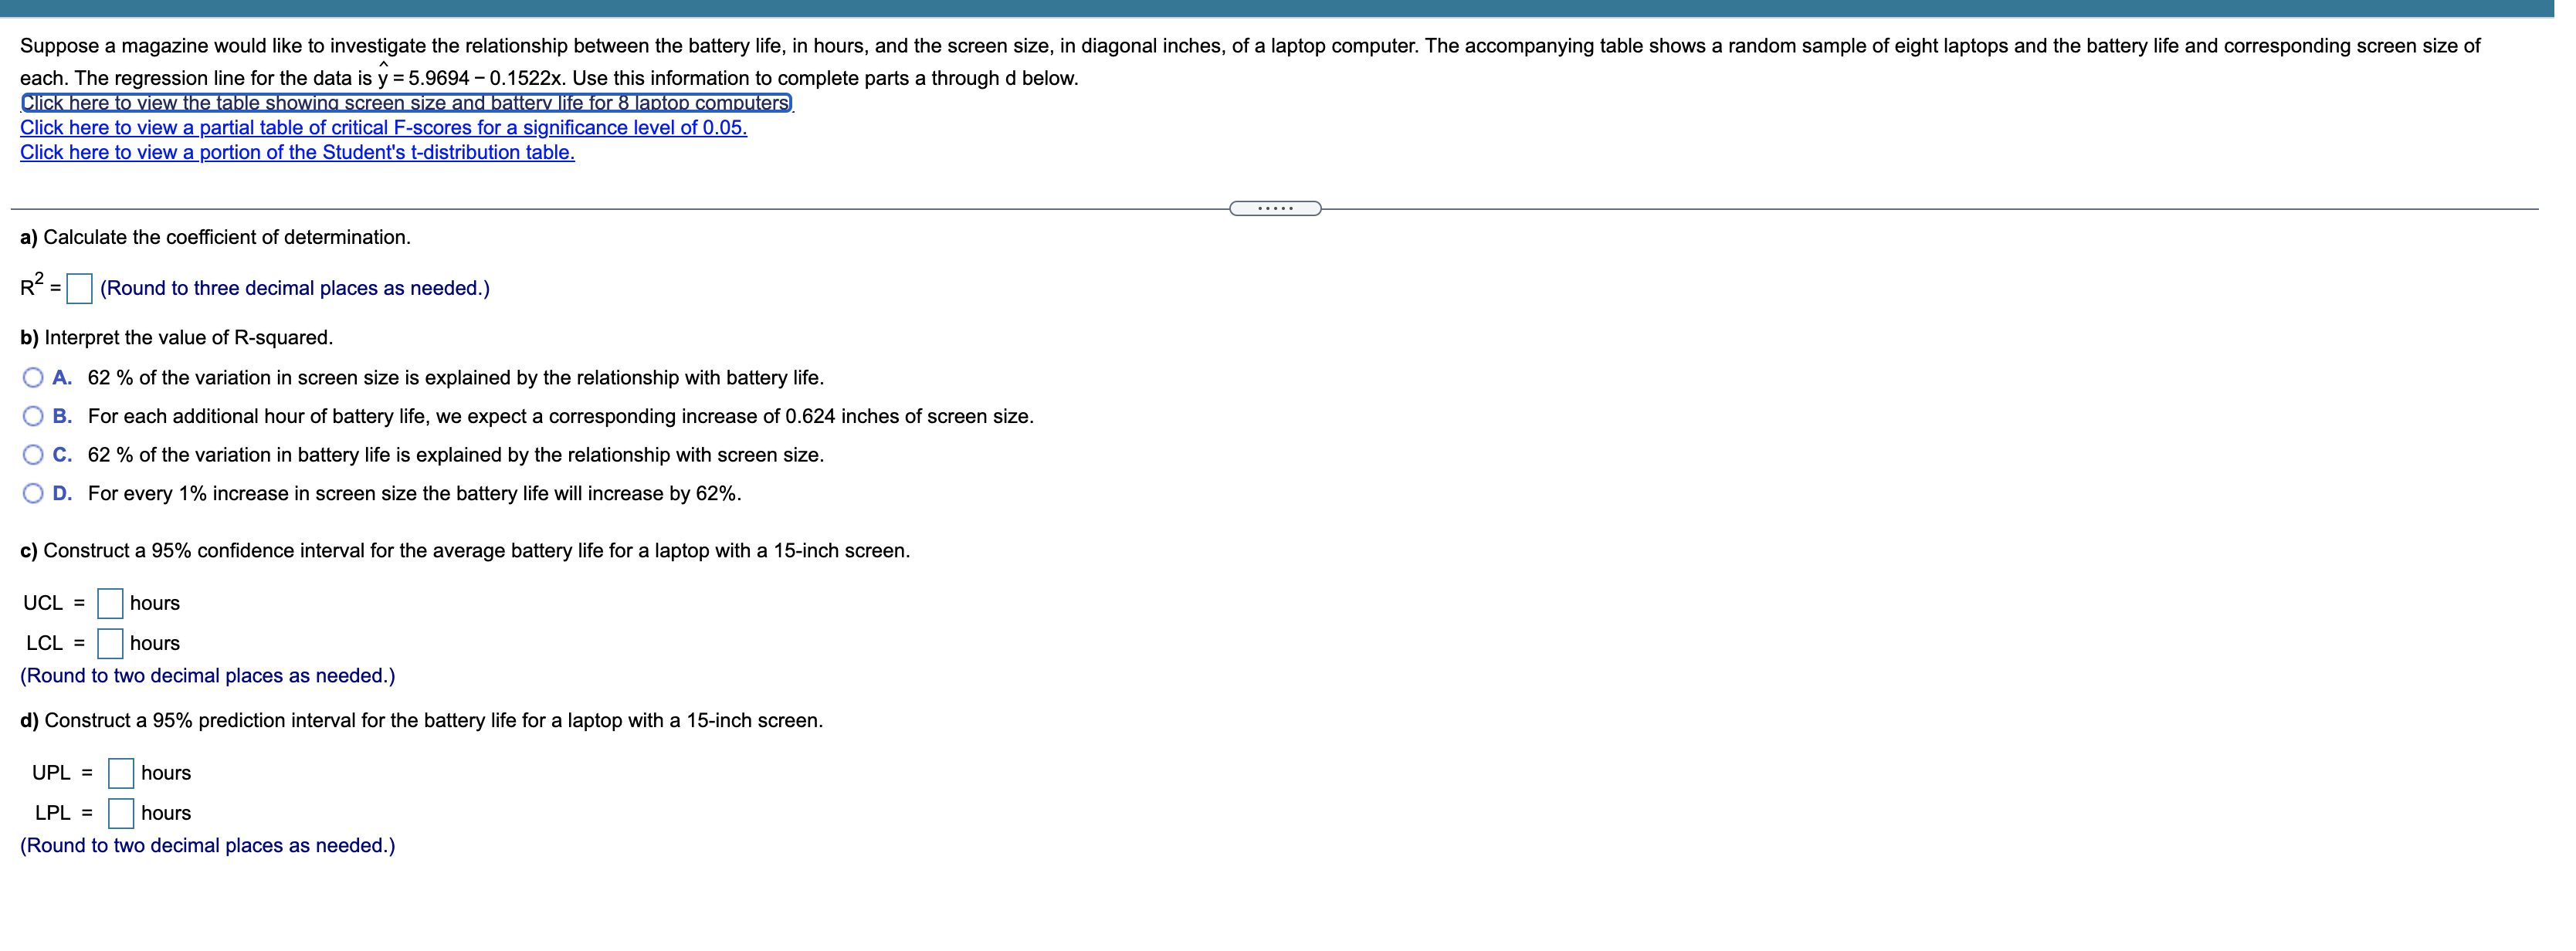
X Table of Critical F-scores Student's t-distribution Cancel of Battery Life and Screen Siz F-distribution Battery Life Screen Size Probabilities under the t-distribution Curve 3.6 15.5 3.3 17.3 1 Tail 0.200 0.100 0.050 0.025 0.010 4.1 14.6 2 Tail 0.400 0.200 0.100 0.050 0.020 3.9 12.1 Conf Lev 0.600 0.800 0.900 0.950 0.980 3.5 14.3 df Area in Table 4.1 13.2 1.376 3.078 6.314 12.706 31.821 4.4 11.7 1.061 1.886 2.920 4.303 6.965 WN 3.9 12.7 0.978 1.638 2.353 3.182 4.541 Fa 0.941 1.533 2.132 2.776 3.747 0.920 1.476 2.015 2.571 AREA IN THE RIGHT TAIL OF DISTRIBUTION = 0.05 3.365 0.906 1.440 1.943 2.447 3.143 2 5 7 Print Done 0.896 1.415 1.895 2.365 2.998 8 10 161.448 199.500 215.707 224.583 230. 162 0.889 233.986 1.397 236.768 238.883 240.543 1.860 2.306 2.896 241.882 0.883 1.383 1.833 18.513 19.000 2.262 19.164 19.247 2.821 19.296 19.330 19.353 19.371 19.385 19.396 W N 0.879 1.372 1.812 2.228 10.128 9.552 2.764 9.277 9.117 9.013 8.941 8.887 8.845 8.812 8.786 7.709 6.944 6.591 6.388 6.256 6.163 6.094 6.041 5.999 5.964 0.876 1.363 1.796 2.201 2.718 6.608 5.786 5.409 5.192 5.050 4.950 4.876 4.818 4.772 4.735 0.873 1.356 1.782 2.179 2.681 5.987 5.143 4.757 4.534 4.387 4.284 4.207 4.147 4.099 4.060 0.870 1.350 1.771 2.160 2.650 5.591 4.737 4.347 4.120 3.972 3.866 3.787 3.726 3.677 3.637 0.868 1.345 1.761 2.145 2.624 5.318 4.459 4.066 3.838 3.687 3.581 3.500 3.438 3.388 3.347 0.866 1.341 1.753 2.131 2.602 5.1 17 4.256 3.863 3.633 3.482 3.374 3.293 3.230 3.179 3.137 0.865 1.337 1.746 2.120 2.583 4.965 4.103 3.708 3.478 3.326 3.217 3.135 3.072 3.020 2.978 17 0.863 1.333 1.740 2.110 2.567 18 0.862 1.330 1.734 2.101 2.552 19 0.861 1.328 1.729 2.093 2.539 20 0.860 1.325 1.725 2.086 2.528 df Print Done Conf Lev 0.600 0.800 0.900 0.950 0.980 2 Tail 0.400 0.200 0.100 0.050 0.020 1 Tail 0.200 0.100 0.050 0.025 0.010Suppose a magazine would like to investigate the relationship between the battery life, in hours, and the screen size, in diagonal inches, of a laptop computer. The accompanying table shows a random sample of eight laptops and the battery life and corresponding screen size of each. The regression line for the data is y = 5.9694 - 0.1522x. Use this information to complete parts a through d below. Click here to view the fable showing screen size and battery life for 8 laptop computers Click here to view a partial table of critical F-scores for a significance level of 0.05. Click here to view a portion of the Student's t-distribution table. a) Calculate the coefficient of determination. R2 = (Round to three decimal places as needed.) b) Interpret the value of R-squared. O A. 62 % of the variation in screen size is explained by the relationship with battery life. O B. For each additional hour of battery life, we expect a corresponding increase of 0.624 inches of screen size. O C. 62 % of the variation in battery life is explained by the relationship with screen size. O D. For every 1% increase in screen size the battery life will increase by 62%. c) Construct a 95% confidence interval for the average battery life for a laptop with a 15-inch screen. UCL = hours LCL = hours (Round to two decimal places as needed.) d) Construct a 95% prediction interval for the battery life for a laptop with a 15-inch screen. UPL = hours LPL = hours (Round to two decimal places as needed.)