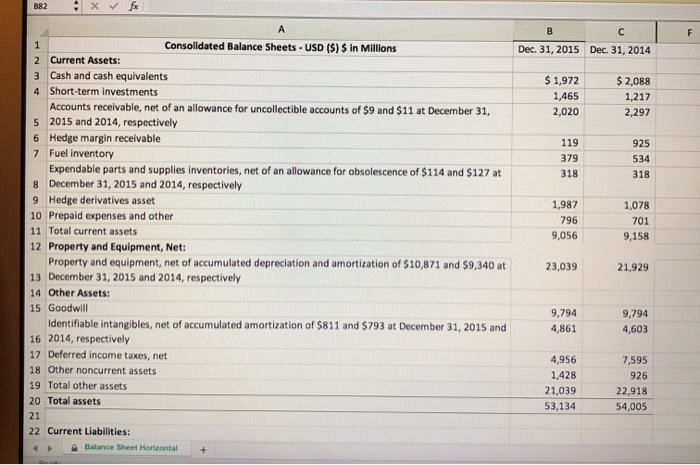
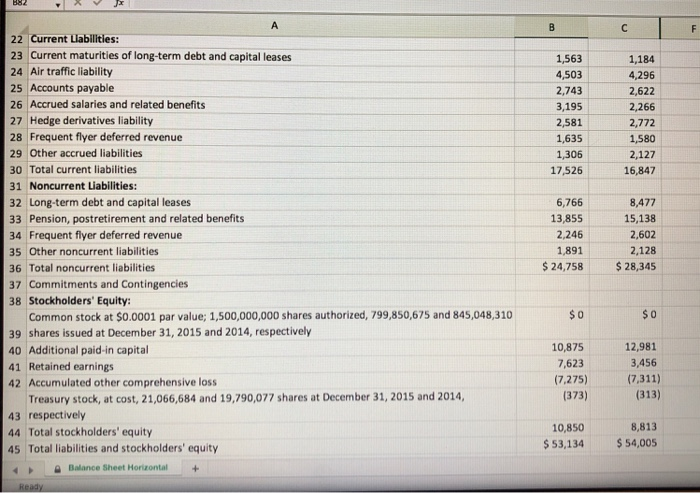
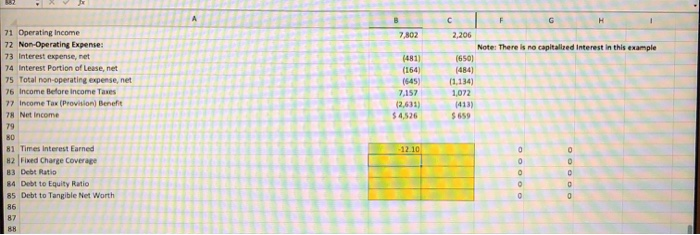
x x B . IF Dec 31, 2015 Dec 31, 2014 $ 1,972 1,465 2,020 $ 2,088 1,217 2,297 119 379 318 925 534 318 1,987 1,078 796 701 Consolidated Balance Sheets - USD ($) $ in Millions 2 Current Assets: 3 Cash and cash equivalents 4 Short-term investments Accounts receivable, net of an allowance for uncollectible accounts of $9 and $11 at December 31, 5 2015 and 2014, respectively 6 Hedge margin receivable 7 Fuel inventory Expendable parts and supplies inventories, net of an allowance for obsolescence of $114 and $127 at 8 December 31, 2015 and 2014, respectively 9 Hedge derivatives asset 10 Prepaid expenses and other 11 Total current assets 12 Property and Equipment, Net: Property and equipment, net of accumulated depreciation and amortization of $10,871 and $9.340 at 13 December 31, 2015 and 2014, respectively 14 Other Assets: 15 Goodwill Identifiable intangibles, net of accumulated amortization of $811 and $793 at December 31, 2015 and 16 2014, respectively 17 Deferred income taxes, net 18 Other noncurrent assets 19 Total other assets 20 Total assets 9,056 9,158 23,039 21,929 9,794 4,861 9,794 4,603 4,956 1.428 21,039 53,134 7,595 926 22,918 54,005 22 Current Liabilities: Balance Sheet Horizontal + XX 1,563 4,503 2,743 3,195 2,581 1,635 1,306 17,526 1,184 4,296 2,622 2,266 2,772 1,580 2,127 16,847 22 Current Liabilities: 23 Current maturities of long-term debt and capital leases 24 Air traffic liability 25 Accounts payable 26 Accrued salaries and related benefits 27 Hedge derivatives liability 28 Frequent flyer deferred revenue 29 Other accrued liabilities 30 Total current liabilities 31 Noncurrent Liabilities: 32 Long-term debt and capital leases 33 Pension, postretirement and related benefits 34 Frequent flyer deferred revenue 35 Other noncurrent liabilities 36 Total noncurrent liabilities 37 Commitments and Contingencies 38 Stockholders' Equity: Common stock at $0.0001 par value; 1,500,000,000 shares authorized, 799,850,675 and 845,048,310 39 shares issued at December 31, 2015 and 2014, respectively 40 Additional paid-in capital 41 Retained earnings 42 Accumulated other comprehensive loss Treasury stock, at cost, 21,066,684 and 19,790,077 shares at December 31, 2015 and 2014, 43 respectively 44 Total stockholders' equity 45 Total liabilities and stockholders' equity Balance Sheet Horizontal 6,766 13,855 2,246 1,891 $ 24,758 8,477 15,138 2,602 2,128 $ 28,345 $0 $0 10,875 7,623 (7,275) (373) 12,981 3,456 (7,311) (313) 10,850 $ 53,134 8,813 $ 54,005 Ready 12 Months Ended Dec 31, 2015 Dec. 31, 2014 $ 28,898 5,884 34,782 $ 28,688 6,266 34,954 813 934 5,109 40,704 4,474 40,362 Consolidated Statements of Operations - USD ($) $ in Millions 49 Passenger: 50 Mainline 51 Regional carriers 52 Total passenger revenue 53 Cargo 54 Other 55 Total operating revenue 56 Operating Expense: 57 Salaries and related costs 58 Aircraft fuel and related taxes 59 Regional carriers expense 60 Aircraft maintenance materials and outside repairs 61 Contracted services 62 Depreciation and amortization 63 Passenger commissions and other selling expenses 64 Landing fees and other rents 65 Profit sharing 66 Passenger service 67 Aircraft rent 68 Restructuring and other 69 Other 70 Total operating expense 71 Operating Income Balance Sheet Horizontal 8,776 6,544 4,241 1,848 1,848 1,835 1,672 1,493 1,490 872 250 35 1,998 32,902 7,802 8,120 11,668 5,237 1,828 1,749 1,771 1,700 1,442 1,085 810 233 716 1,797 38,156 2,206 7802 2.206 Note: There is no capitalized interest in 71 Operating Income 22 Non-Operating Expense: 23 Interest expense, net 74 Interest Portion of Lease, net 75 Total non-operating expense, net 76 Income before income Taxes 77 Income Tax (Provision) Benefit 7 Net Income (164) (545) 7.157 (484) (1,134) 1,072 BO 81 Times interest Earned 2 Fixed Charge Coverage 83 Debt Ratio 84 Debt to Equity Ratio 85 Debt to Tangible Net Please add excel formulas for the yellow boxes at bottom. Explanations welcome! Note- there is no capitalized interest in this example x x B . IF Dec 31, 2015 Dec 31, 2014 $ 1,972 1,465 2,020 $ 2,088 1,217 2,297 119 379 318 925 534 318 1,987 1,078 796 701 Consolidated Balance Sheets - USD ($) $ in Millions 2 Current Assets: 3 Cash and cash equivalents 4 Short-term investments Accounts receivable, net of an allowance for uncollectible accounts of $9 and $11 at December 31, 5 2015 and 2014, respectively 6 Hedge margin receivable 7 Fuel inventory Expendable parts and supplies inventories, net of an allowance for obsolescence of $114 and $127 at 8 December 31, 2015 and 2014, respectively 9 Hedge derivatives asset 10 Prepaid expenses and other 11 Total current assets 12 Property and Equipment, Net: Property and equipment, net of accumulated depreciation and amortization of $10,871 and $9.340 at 13 December 31, 2015 and 2014, respectively 14 Other Assets: 15 Goodwill Identifiable intangibles, net of accumulated amortization of $811 and $793 at December 31, 2015 and 16 2014, respectively 17 Deferred income taxes, net 18 Other noncurrent assets 19 Total other assets 20 Total assets 9,056 9,158 23,039 21,929 9,794 4,861 9,794 4,603 4,956 1.428 21,039 53,134 7,595 926 22,918 54,005 22 Current Liabilities: Balance Sheet Horizontal + XX 1,563 4,503 2,743 3,195 2,581 1,635 1,306 17,526 1,184 4,296 2,622 2,266 2,772 1,580 2,127 16,847 22 Current Liabilities: 23 Current maturities of long-term debt and capital leases 24 Air traffic liability 25 Accounts payable 26 Accrued salaries and related benefits 27 Hedge derivatives liability 28 Frequent flyer deferred revenue 29 Other accrued liabilities 30 Total current liabilities 31 Noncurrent Liabilities: 32 Long-term debt and capital leases 33 Pension, postretirement and related benefits 34 Frequent flyer deferred revenue 35 Other noncurrent liabilities 36 Total noncurrent liabilities 37 Commitments and Contingencies 38 Stockholders' Equity: Common stock at $0.0001 par value; 1,500,000,000 shares authorized, 799,850,675 and 845,048,310 39 shares issued at December 31, 2015 and 2014, respectively 40 Additional paid-in capital 41 Retained earnings 42 Accumulated other comprehensive loss Treasury stock, at cost, 21,066,684 and 19,790,077 shares at December 31, 2015 and 2014, 43 respectively 44 Total stockholders' equity 45 Total liabilities and stockholders' equity Balance Sheet Horizontal 6,766 13,855 2,246 1,891 $ 24,758 8,477 15,138 2,602 2,128 $ 28,345 $0 $0 10,875 7,623 (7,275) (373) 12,981 3,456 (7,311) (313) 10,850 $ 53,134 8,813 $ 54,005 Ready 12 Months Ended Dec 31, 2015 Dec. 31, 2014 $ 28,898 5,884 34,782 $ 28,688 6,266 34,954 813 934 5,109 40,704 4,474 40,362 Consolidated Statements of Operations - USD ($) $ in Millions 49 Passenger: 50 Mainline 51 Regional carriers 52 Total passenger revenue 53 Cargo 54 Other 55 Total operating revenue 56 Operating Expense: 57 Salaries and related costs 58 Aircraft fuel and related taxes 59 Regional carriers expense 60 Aircraft maintenance materials and outside repairs 61 Contracted services 62 Depreciation and amortization 63 Passenger commissions and other selling expenses 64 Landing fees and other rents 65 Profit sharing 66 Passenger service 67 Aircraft rent 68 Restructuring and other 69 Other 70 Total operating expense 71 Operating Income Balance Sheet Horizontal 8,776 6,544 4,241 1,848 1,848 1,835 1,672 1,493 1,490 872 250 35 1,998 32,902 7,802 8,120 11,668 5,237 1,828 1,749 1,771 1,700 1,442 1,085 810 233 716 1,797 38,156 2,206 7802 2.206 Note: There is no capitalized interest in 71 Operating Income 22 Non-Operating Expense: 23 Interest expense, net 74 Interest Portion of Lease, net 75 Total non-operating expense, net 76 Income before income Taxes 77 Income Tax (Provision) Benefit 7 Net Income (164) (545) 7.157 (484) (1,134) 1,072 BO 81 Times interest Earned 2 Fixed Charge Coverage 83 Debt Ratio 84 Debt to Equity Ratio 85 Debt to Tangible Net Please add excel formulas for the yellow boxes at bottom. Explanations welcome! Note- there is no capitalized interest in this example