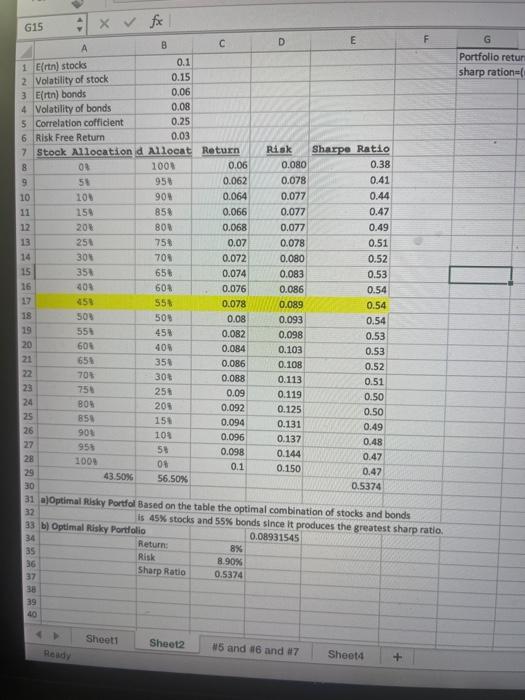
: x x D E F G Portfolio retur sharp ration=1 0.03 G15 A B 0.1 1 Ertn) stocks 0.15 2 Volatility of stock 3 Ertn) bonds 0.06 4 Volatility of bonds 0.08 5 Correlation coffident 0.25 6 Risk Free Return 7 Stock Allocation d Allocat Return 8 OR 100% 0.06 9 58 958 0.062 10 101 901 0.064 11 159 858 0.066 12 201 80 0.068 13 251 758 0.07 14 30 708 0.072 15 358 65% 0.074 16 408 608 0.076 458 55% 0.078 18 500 508 0.08 19 55 45% 0.082 20 605 400 0.084 21 654 35% 0.086 22 70% 303 0.088 23 75 258 0.09 24 BOS 203 25 858 151 0.094 26 90 108 0.096 27 953 5 28 1000 08 0.1 29 43.50% 56.50% 30 Risk 0.080 0.078 0.077 0.077 0.077 0.078 0.080 0.083 0.086 0.089 0.093 0.098 0.103 0.108 0.113 0.119 0.125 0.131 0.137 0.144 0.150 Sharpe Ratio 0.38 0.41 0.44 0.47 0.49 0.51 0.52 0.53 0.54 0.54 0.54 0.53 0.53 0.52 0.51 0.50 0.50 0.49 0.48 0.47 0.47 0.5374 0.092 0.098 31 a)Optimal Risky Portfol Based on the table the optimal combination of stocks and bonds is 45% stocks and 55% bonds since it produces the greatest sharp ratio, 33 b) Optimal Risky Portfolio 0.08931545 34 Return: 35 8% Risk 8.90% 36 Sharp Ratio 0.5374 37 38 39 40 Sheet1 Sheet2 Roady 5 and 6 and 7 Shoot4 + 1. Using the table created, plot the opportunity set of risky assets in Excel. Then vary the correlation between stocks and bonds from + 1 to -1 and describe the changes in shape of the efficient frontier as you do so. Upload the Excel file that contains the table & graph. Make sure to include in the Excel file submission, a description of the efficient frontier's shape as you vary the correlation I Focus 133 80 000 : x x D E F G Portfolio retur sharp ration=1 0.03 G15 A B 0.1 1 Ertn) stocks 0.15 2 Volatility of stock 3 Ertn) bonds 0.06 4 Volatility of bonds 0.08 5 Correlation coffident 0.25 6 Risk Free Return 7 Stock Allocation d Allocat Return 8 OR 100% 0.06 9 58 958 0.062 10 101 901 0.064 11 159 858 0.066 12 201 80 0.068 13 251 758 0.07 14 30 708 0.072 15 358 65% 0.074 16 408 608 0.076 458 55% 0.078 18 500 508 0.08 19 55 45% 0.082 20 605 400 0.084 21 654 35% 0.086 22 70% 303 0.088 23 75 258 0.09 24 BOS 203 25 858 151 0.094 26 90 108 0.096 27 953 5 28 1000 08 0.1 29 43.50% 56.50% 30 Risk 0.080 0.078 0.077 0.077 0.077 0.078 0.080 0.083 0.086 0.089 0.093 0.098 0.103 0.108 0.113 0.119 0.125 0.131 0.137 0.144 0.150 Sharpe Ratio 0.38 0.41 0.44 0.47 0.49 0.51 0.52 0.53 0.54 0.54 0.54 0.53 0.53 0.52 0.51 0.50 0.50 0.49 0.48 0.47 0.47 0.5374 0.092 0.098 31 a)Optimal Risky Portfol Based on the table the optimal combination of stocks and bonds is 45% stocks and 55% bonds since it produces the greatest sharp ratio, 33 b) Optimal Risky Portfolio 0.08931545 34 Return: 35 8% Risk 8.90% 36 Sharp Ratio 0.5374 37 38 39 40 Sheet1 Sheet2 Roady 5 and 6 and 7 Shoot4 + 1. Using the table created, plot the opportunity set of risky assets in Excel. Then vary the correlation between stocks and bonds from + 1 to -1 and describe the changes in shape of the efficient frontier as you do so. Upload the Excel file that contains the table & graph. Make sure to include in the Excel file submission, a description of the efficient frontier's shape as you vary the correlation I Focus 133 80 000