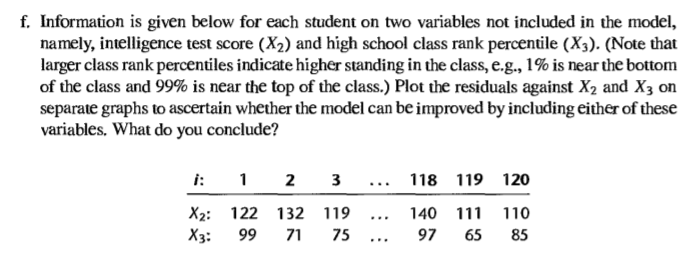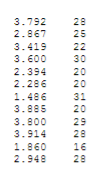

X2: X3:


Yi: Xi:


1.19. Grade point average. The director of admissions of a small college selected 120 students at random from the new freshman class in a study to determine whether a student's grade point average (GPA) at the end of the freshman year (Y) can be predicted from the ACT test score (X). The results of the study follow. Assume that first-order regression model (1.1) is appropriate. 118 119 16 2 3 120 Xi: 21 Yi: 14 28 28 28 3.897 3.885 3.778 3.914 1.860 2.948 f. Information is given below for each student on two variables not included in the model, namely, intelligence test score (X2) and high school class rank percentile (X3). (Note that larger class rank percentiles indicate higher standing in the class, eg, 1% is near the bottom of the class and 99% is near the top of the class.) Plot the residuals against X2 and X3 on separate graphs to ascertain whether the model can be improved by including either of these variables. What do you conclude? i 2 3... 118 119 120 : 99 71 75 97 65 85 122 99 71 119 95 99 75 131 46 139 77 113 85 136 99 75 13 97 125 9 142 99 120 97 132 106 107 125 93 121 0 119 63 128 78 06 93 123 22 84 87 34 99 128 95 126 63 121 79 104 86 113 0 133 97 25 39 128 97 57 113 12 107 6 118 119 75 E3 115 15 113 110 22 93 118 99 114 90 112 99 85 95 84 102 58 114 6 116 82 93 34 120 34 117 23 119 95 115 41 113 28 108 8 106 129 106 LEDE 9S 76 108 138 70 106 44 111 33 01 77 113 57 131 9 140 97 65 85 110 z z z a a z z z z a z z s 2 2 3 2 2 2 2 2 2 2 2 2 2 2 2 2 1 2 2 2 2 2 3 2 2 2 3 2 2 2 2 3 1 1 1 2 1 2 2 3.547 24 3.91 30 3.160 21 2.194 20 3.323 3.936 2.922 25 2.716 3.370 3.06 2.642 2.452 2.55 3.714 1.806 3.516 3.039 2.966 2.482 2.700 3.920 2.834 3.222 3.084 4.000 3.511 3.323 3.072 2.079 3.875 3.208 2.920 3.345 3.956 3.808 2.506 3.886 2.183 3.429 3.024 3.750 3.833 .113 27 2.875 21 2.747 2.311 1.841 25 1.583 2.879 20 3.591 32 2.914 24 3.716 35 2.800 25 3.621 28 30 29 23 25 23 30 21 24 32 18 23 20 23 18 18 29 20 23 26 28 34 20 20 26 32 25 27 27 29 19 21 24 27 25 18 29 24 19 18 18 3.792 28 2.867 25 3.419 22 3.600 30 2.394 20 2.286 20 1.486 31 3.885 20 3.800 2s 3.914 28 1.860 1 2.948 1.19. Grade point average. The director of admissions of a small college selected 120 students at random from the new freshman class in a study to determine whether a student's grade point average (GPA) at the end of the freshman year (Y) can be predicted from the ACT test score (X). The results of the study follow. Assume that first-order regression model (1.1) is appropriate. 118 119 16 2 3 120 Xi: 21 Yi: 14 28 28 28 3.897 3.885 3.778 3.914 1.860 2.948 f. Information is given below for each student on two variables not included in the model, namely, intelligence test score (X2) and high school class rank percentile (X3). (Note that larger class rank percentiles indicate higher standing in the class, eg, 1% is near the bottom of the class and 99% is near the top of the class.) Plot the residuals against X2 and X3 on separate graphs to ascertain whether the model can be improved by including either of these variables. What do you conclude? i 2 3... 118 119 120 : 99 71 75 97 65 85 122 99 71 119 95 99 75 131 46 139 77 113 85 136 99 75 13 97 125 9 142 99 120 97 132 106 107 125 93 121 0 119 63 128 78 06 93 123 22 84 87 34 99 128 95 126 63 121 79 104 86 113 0 133 97 25 39 128 97 57 113 12 107 6 118 119 75 E3 115 15 113 110 22 93 118 99 114 90 112 99 85 95 84 102 58 114 6 116 82 93 34 120 34 117 23 119 95 115 41 113 28 108 8 106 129 106 LEDE 9S 76 108 138 70 106 44 111 33 01 77 113 57 131 9 140 97 65 85 110 z z z a a z z z z a z z s 2 2 3 2 2 2 2 2 2 2 2 2 2 2 2 2 1 2 2 2 2 2 3 2 2 2 3 2 2 2 2 3 1 1 1 2 1 2 2 3.547 24 3.91 30 3.160 21 2.194 20 3.323 3.936 2.922 25 2.716 3.370 3.06 2.642 2.452 2.55 3.714 1.806 3.516 3.039 2.966 2.482 2.700 3.920 2.834 3.222 3.084 4.000 3.511 3.323 3.072 2.079 3.875 3.208 2.920 3.345 3.956 3.808 2.506 3.886 2.183 3.429 3.024 3.750 3.833 .113 27 2.875 21 2.747 2.311 1.841 25 1.583 2.879 20 3.591 32 2.914 24 3.716 35 2.800 25 3.621 28 30 29 23 25 23 30 21 24 32 18 23 20 23 18 18 29 20 23 26 28 34 20 20 26 32 25 27 27 29 19 21 24 27 25 18 29 24 19 18 18 3.792 28 2.867 25 3.419 22 3.600 30 2.394 20 2.286 20 1.486 31 3.885 20 3.800 2s 3.914 28 1.860 1 2.948


