

Answered step by step
Verified Expert Solution
Question
1 Approved Answer
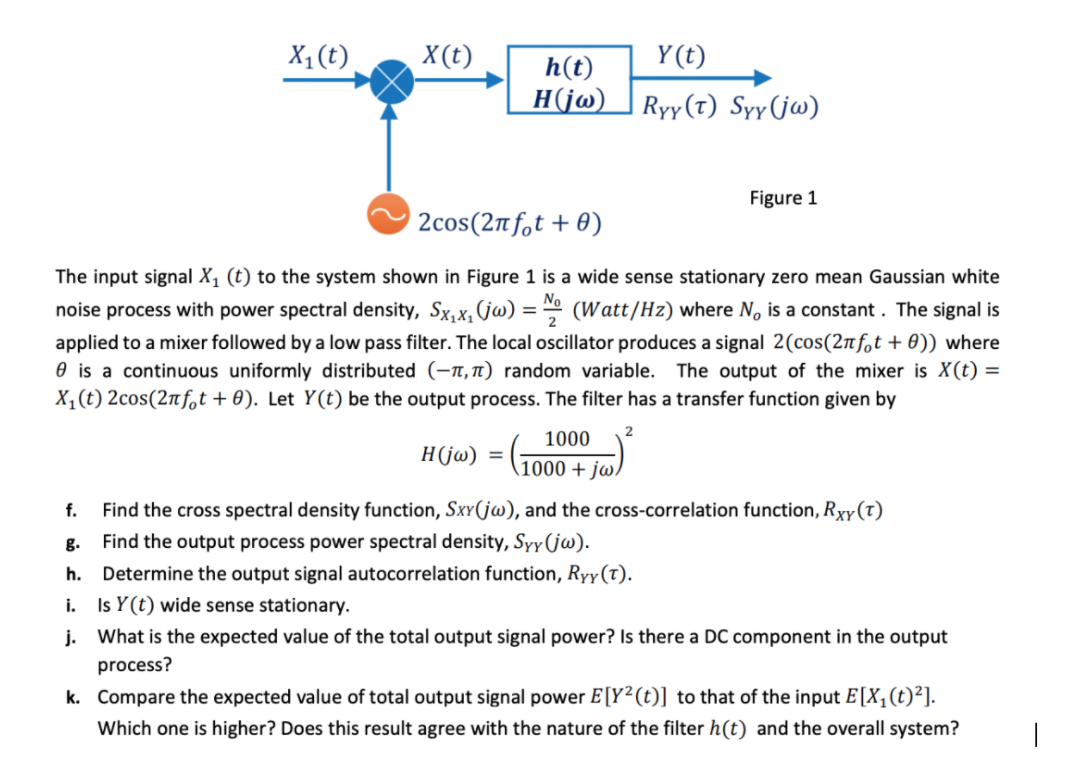
xi(t) X(t) h(t) | H(jw) Y(t) Ryy(t) Syy (jw) Figure 1 v2cos(21fot+0) The input signal X, (t) to the system shown in Figure 1 is
Step by Step Solution
There are 3 Steps involved in it
Step: 1

Get Instant Access to Expert-Tailored Solutions
See step-by-step solutions with expert insights and AI powered tools for academic success
Step: 2

Step: 3
Ace Your Homework with AI
Get the answers you need in no time with our AI-driven, step-by-step assistance
Get Started
General Accounting Financial Accounting
Authors: Bbc Kikumbi Mwepu
1st Edition
6206329488, 978-6206329480