XYZ Inc.

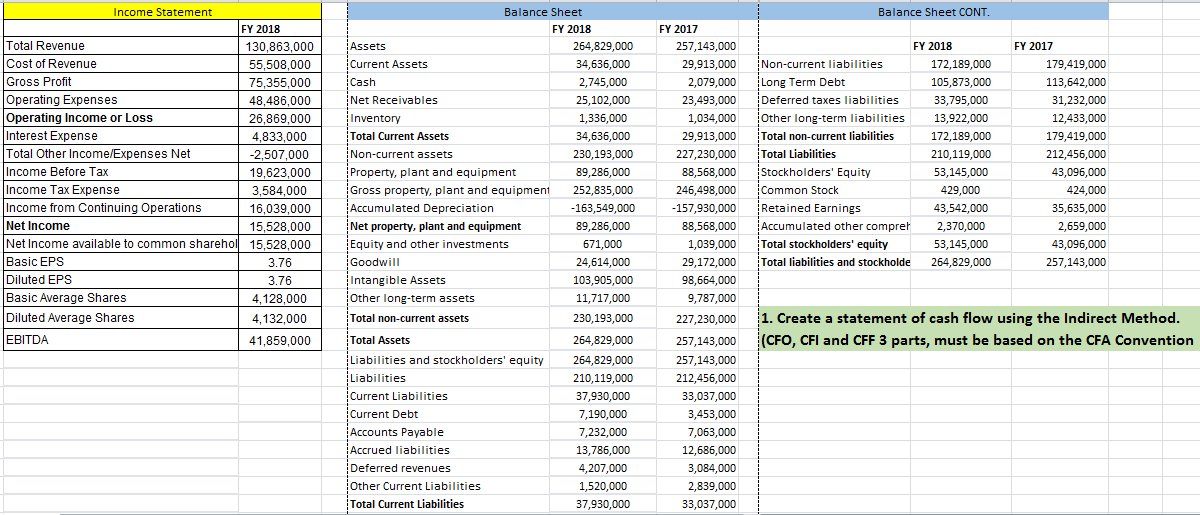
Income Statement Balance Sheet CONT. FY 2018 Total Revenue 130,863,000 Cost of Revenue 55,508,000 Gross Profit 75,355,000 Operating Expenses 48,486,000 Operating Income or Loss 26,869,000 Interest Expense 4,833,000 Total Other Income/Expenses Net -2,507.000 Income Before Tax 19,623,000 Income Tax Expense 3,584,000 Income from Continuing Operations 16,039,000 Net Income 15,528,000 Net Income available to common shareholl 15,528,000 Basic EPS 3.76 Diluted EPS 3.76 Basic Average Shares 4,128,000 Diluted Average Shares 4,132,000 EBITDA 41,859,000 Balance Sheet FY 2018 Assets 264,829,000 Current Assets 34,636,000 Cash 2,745,000 Net Receivables 25,102,000 Inventory 1,336,000 Total Current Assets 34,636,000 Non-current assets 230,193,000 Property, plant and equipment 89,286,000 Gross property, plant and equipment 252,835,000 Accumulated Depreciation -163,549,000 Net property, plant and equipment 89,286,000 Equity and other investments 671,000 Goodwill 24,614,000 Intangible Assets 103,905,000 Other long-term assets 11,717,000 Total non-current assets 230,193,000 Total Assets 264,829,000 Liabilities and stockholders' equity 264,829,000 Liabilities 210,119,000 Current Liabilities 37,930,000 Current Debt 7,190,000 Accounts Payable 7,232,000 Accrued liabilities 13,786,000 Deferred revenues 4,207,000 Other Current Liabilities 1,520,000 Total Current Liabilities 37,930,000 FY 2017 257,143,000 29,913,000 2,079,000 23,493,000 1,034,000 29,913,000 227,230,000 88,568,000 246,498,000 - 157,930,000 88,568,000 1,039,000 29,172,000 98,664,000 9,787,000 227,230,000 FY 2018 Non-current liabilities 172,189,000 Long Term Debt 105,873,000 Deferred taxes liabilities 33,795,000 Other long-term liabilities 13,922,000 Total non-current liabilities 172,189,000 Total Liabilities 210,119,000 Stockholders' Equity 53,145,000 Common Stock 429,000 Retained Earnings 43,542,000 Accumulated other compreh 2,370,000 Total stockholders' equity 53,145,000 Total liabilities and stockholde 264,829,000 FY 2017 179,419,000 113,642,000 31,232,000 12,433,000 179,419,000 212,456,000 43,096,000 424,000 35,635,000 2,659,000 43,096,000 257,143,000 1. Create a statement of cash flow using the Indirect Method. (CFO, CFI and CFF 3 parts, must be based on the CFA Convention 257,143,000 257,143,000 212,456,000 33,037,000 3,453,000 7,063,000 12,686,000 3,084,000 2,839,000 33,037,000


