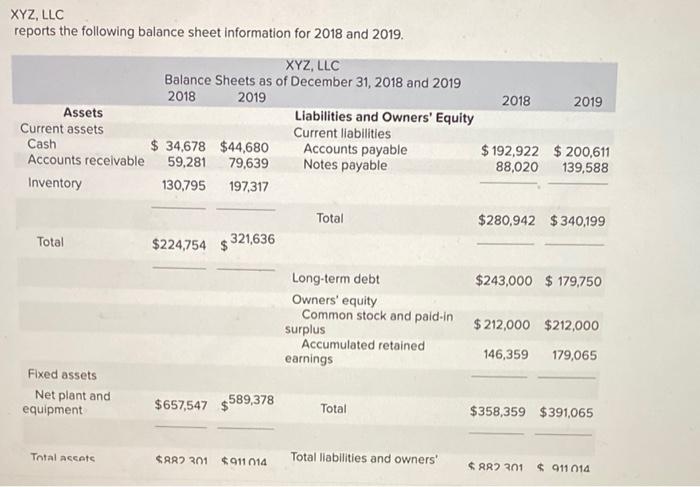
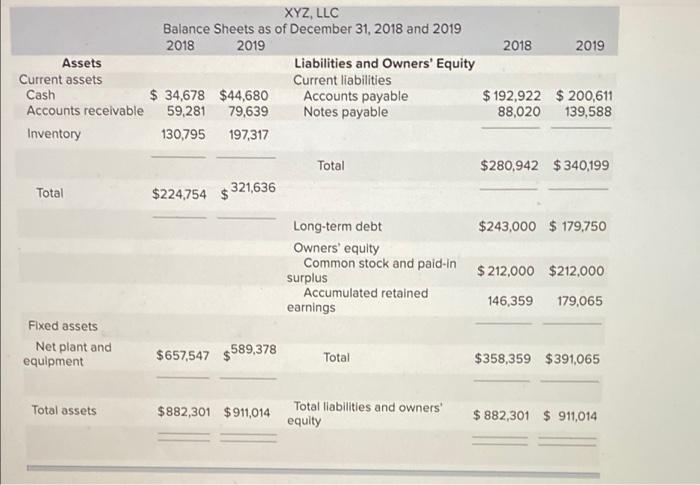
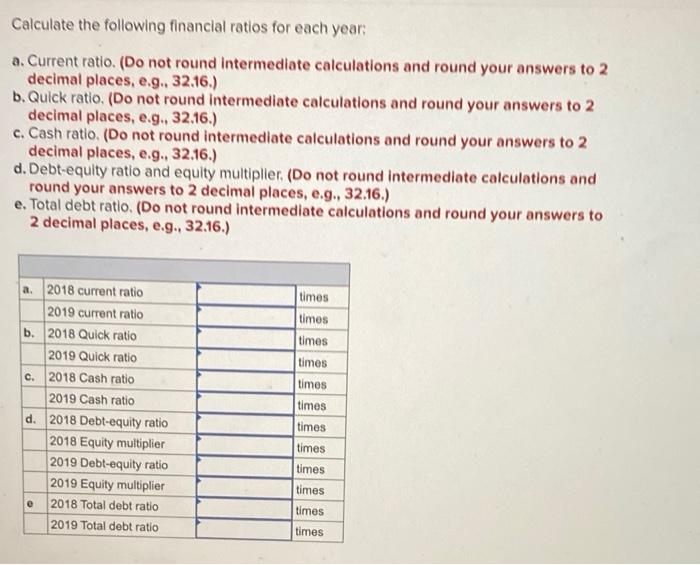
XYZ, LLC reports the following balance sheet information for 2018 and 2019. XYZ, LLC Balance Sheets as of December 31, 2018 and 2019 2018 2019 Assets Liabilities and Owners' Equity Current assets Current liabilities Cash $ 34,678 $44,680 Accounts payable Accounts receivable 59,281 79,639 Notes payable Inventory 130,795 197,317 2018 2019 $ 192,922 $ 200,611 88,020 139,588 Total $280,942 $340,199 Total $224,754 $ 321,636 $243,000 $ 179,750 Long-term debt Owners' equity Common stock and paid in surplus Accumulated retained earnings $ 212,000 $212,000 146,359 179,065 Fixed assets Net plant and equipment $657,547 $589,378 Total $358,359 $391,065 Total acces CAR 301 $911 014 Total liabilities and owners' AR 201 $ 911 014 XYZ, LLC Balance Sheets as of December 31, 2018 and 2019 2018 2019 2018 2019 Assets Liabilities and Owners' Equity Current assets Current liabilities Cash $ 34,678 $44,680 Accounts payable $ 192,922 $ 200,611 Accounts receivable 59,281 79,639 Notes payable 88,020 139,588 Inventory 130,795 197,317 Total $280,942 $340,199 Total $224,754 $ 321,636 Long-term debt $243,000 $ 179,750 Owners' equity Common stock and paid-in $ 212,000 $212,000 surplus Accumulated retained earnings 146,359 179,065 Fixed assets Net plant and equipment $657,547 $589,378 Total $358,359 $391065 Total assets $882,301 $911,014 Total liabilities and owners equity $ 882,301 $ 911,014 Calculate the following financial ratios for each year a. Current ratio (Do not round Intermediate calculations and round your answers to 2 decimal places, e.g. 32.16.) b. Quick ratio. (Do not round Intermediate calculations and round your answers to 2 decimal places, e.g. 32.16.) c. Cash ratio (Do not round intermediate calculations and round your answers to 2 decimal places, e.g., 32.16.) d. Debt-equity ratio and equity multiplier. (Do not round Intermediate calculations and round your answers to 2 decimal places, e.g., 32.16.) e. Total debt ratio. (Do not round intermediate calculations and round your answers to 2 decimal places, e.g., 32.16.) times times a. 2018 current ratio 2019 current ratio b. 2018 Quick ratio 2019 Quick ratio c. 2018 Cash ratio 2019 Cash ratio d. 2018 Debt-equity ratio 2018 Equity multiplier 2019 Debt-equity ratio 2019 Equity multiplier 2018 Total debt ratio 2019 Total debt ratio times times times times times times times times times times


