

Answered step by step
Verified Expert Solution
Question
1 Approved Answer
Y 17 25 52 39 37 26 34 6 57 39 26 42 26 37 49 38 22 55 35 38 55 24 21 22
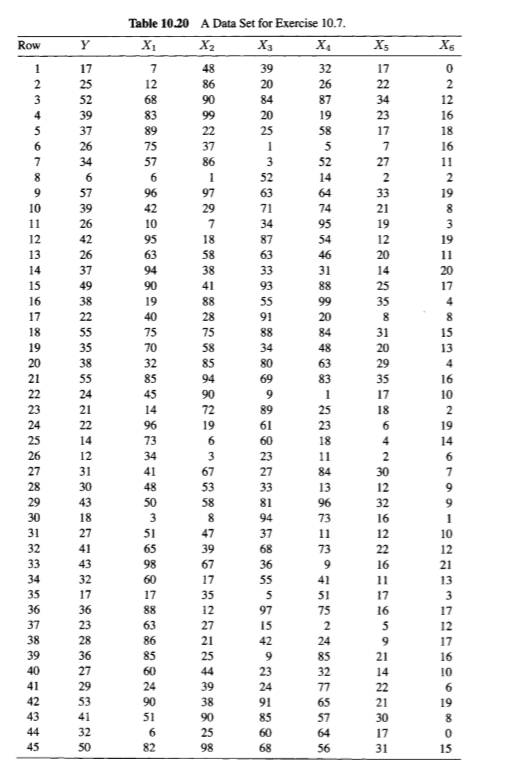
Y 17 25 52 39 37 26 34 6 57 39 26 42 26 37 49 38 22 55 35 38 55 24 21 22 14 12 31 30 43 18 27 41 43 32 17 36 23 28 36 27 29 53 41 32 50 X1 7 12 68 83 89 75 57 6 96 42 10 95 63 94 90 19 40 75 70 32 85 45 14 96 73 34 41 48 50 3 51 65 98 60 17 88 63 86 85 60 24 90 51 6 82 X2 48 86 90 99 22 37 86 1 97 29 7 18 58 38 41 88 28 75 58 85 94 90 72 19 6 3 67 53 58 8 47 39 67 17 35 12 27 21 25 44 39 38 90 25 98 X3 39 20 84 20 25 1 3 52 63 71 34 87 63 33 93 55 91 88 34 80 69 9 89 61 60 23 27 33 81 94 37 68 36 55 5 97 15 42 9 23 24 91 85 60 68 X4 32 26 87 19 58 5 52 14 64 74 95 54 46 31 88 99 20 84 48 63 83 1 25 23 18 11 84 13 96 73 11 73 9 41 51 75 2 24 85 32 77 65 57 64 56 X5 17 22 34 23 17 7 27 2 33 21 19 12 20 14 25 35 8 31 20 29 35 17 18 6 4 2 30 12 32 16 12 22 16 11 17 16 5 9 21 14 22 21 30 17 31 X6 0 2 12 16 18 16 11 2 19 8 3 19 11 20 17 4 8 15 13 4 16 10 2 19 14 6 7 9 9 1 10 12 21 13 3 17 12 17 16 10 6 19 8 0 1510.7 Consider the data set in Table 10.20, which consists of a dependent variable Y and six predictor variables, X1, X2, X6. Analyze the data set for collinearity. In particular. (a) Compute the condition number for the X-variables. Is there any evidence of collinearity? (b) Compute all principal components (PCs) and regress Y on all PCs. Which PCs are significant? (c) Construct the scatter plot of the first two PCs. What would the slope of the least squares regression line describing the relationship between these two PCs be? Why? (d) How many sets of collinearity exist in the data? (e) Which of the variables are involved in each set? (f) What is the relationship among the variables in each set of collinear variables? (g) How many principal components would you use to deal with collinearity in this case? (h) Which model would you recommend to describe the relationship between Y and the other predictors variables? Table 10.20 A Data Set for Exercise 10.7. X2 ; Row Y X1 X5 6 8 9 10 11 1 12 14 13 14 15 16 17 18 19 20 93 55 91 88 34 80 co 69 9 20 84 3 51 51 65 17 88 63 17 16 10 23 27 29 10.7 Consider the data set in Table 10.20, which consists of a dependent variable Y and six predictor variables, X1, X2, X6. Analyze the data set for collinearity. In particular. (a) Compute the condition number for the X-variables. Is there any evidence of collinearity? (b) Compute all principal components (PCs) and regress Y on all PCs. Which PCs are significant? (c) Construct the scatter plot of the first two PCs. What would the slope of the least squares regression line describing the relationship between these two PCs be? Why? (d) How many sets of collinearity exist in the data? (e) Which of the variables are involved in each set? (f) What is the relationship among the variables in each set of collinear variables? (g) How many principal components would you use to deal with collinearity in this case? (h) Which model would you recommend to describe the relationship between Y and the other predictors variables? Table 10.20 A Data Set for Exercise 10.7. X2 ; Row Y X1 X5 6 8 9 10 11 1 12 14 13 14 15 16 17 18 19 20 93 55 91 88 34 80 co 69 9 20 84 3 51 51 65 17 88 63 17 16 10 23 27 29
Step by Step Solution
There are 3 Steps involved in it
Step: 1

Get Instant Access to Expert-Tailored Solutions
See step-by-step solutions with expert insights and AI powered tools for academic success
Step: 2

Step: 3
Ace Your Homework with AI
Get the answers you need in no time with our AI-driven, step-by-step assistance
Get Started
Introduction To Management Accounting With Myaccountinglab And
Authors: Alnoor Bhimani, Charles T. Horngren, Gary L. Sundem, William O. Stratton, Jeff Schatzberg, Dave Burgstahler
1st Edition
1292178116, 978-1292178110