Question
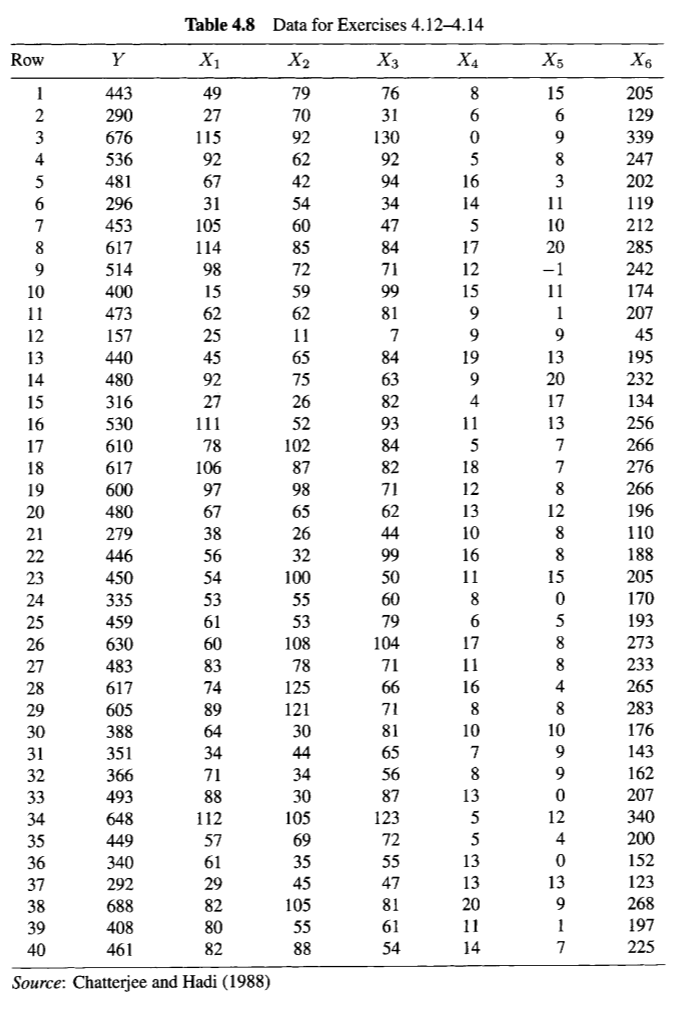
Y X1 X2 X3 X4 X5 X6 443 49 79 76 8 15 205 290 27 70 31 6 6 129 676 115 92 130


Y X1 X2 X3 X4 X5 X6
443 49 79 76 8 15 205
290 27 70 31 6 6 129
676 115 92 130 0 9 339
536 92 62 92 5 8 247
481 67 42 94 16 3 202
296 31 54 34 14 11 119
453 105 60 47 5 10 212
617 114 85 84 17 20 285
514 98 72 71 12 -1 242
400 15 59 99 15 11 174
473 62 62 81 9 1 207
157 25 11 7 9 9 45
440 45 65 84 19 13 195
480 92 75 63 9 20 232
316 27 26 82 4 17 134
530 111 52 93 11 13 256
610 78 102 84 5 7 266
617 106 87 82 18 7 276
600 97 98 71 12 8 266
480 67 65 62 13 12 196
279 38 26 44 10 8 110
446 56 32 99 16 8 188
450 54 100 50 11 15 205
335 53 55 60 8 0 170
459 61 53 79 6 5 193
630 60 108 104 17 8 273
483 83 78 71 11 8 233
617 74 125 66 16 4 265
605 89 121 71 8 8 283
388 64 30 81 10 10 176
351 34 44 65 7 9 143
366 71 34 56 8 9 162
493 88 30 87 13 0 207
648 112 105 123 5 12 340
449 57 69 72 5 4 200
340 61 35 55 13 0 152
292 29 45 47 13 13 123
688 82 105 81 20 9 268
408 80 55 61 11 1 197
461 82 88 54 14 7 225
I want to solve by using R program
solve please by R :(
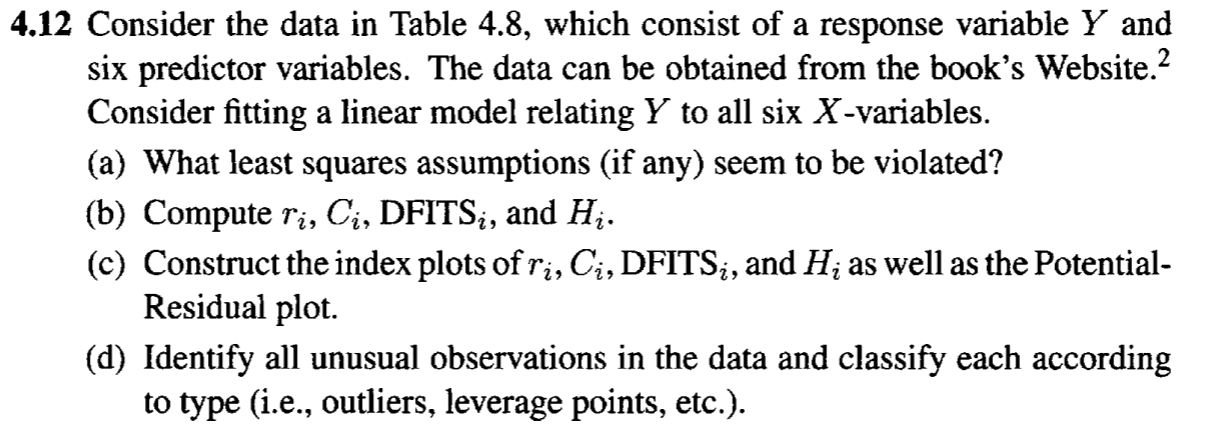
4.12 Consider the data in Table 4.8, which consist of a response variable Y and six predictor variables. The data can be obtained from the book's Website. Consider fitting a linear model relating Y to all six X-variables. (a) What least squares assumptions (if any) seem to be violated? (b) Compute ri, Ci, DFITS;, and H. (c) Construct the index plots of ri,C, DFITS, and H; as well as the Potential- Residual plot. (d) Identify all unusual observations in the data and classify each according to type (i.e., outliers, leverage points, etc.). Table 4.8 | X, Data for Exercises 4.124.14 X3 X4 Row X, 16 443 29 676 Xo 205 129 339 1 115 536 247 202 481 296 43 617 514 400 473 157 440 480 316 S30 232 14 lll 256 6l0 266 611 10 600 480 279 446 4S0 335 459 276 266 196 110 188 205 100 I70 } 193 630 60 108 483 617 605 125 388 351 366 493 233 265 283 176 143 162 207 340 200 152 23 268 48 112 449 340 61 292 29 688 105 408 197 2s 40 46/ 88 Source: Chatterjee and Hadi (1988) 4.12 Consider the data in Table 4.8, which consist of a response variable Y and six predictor variables. The data can be obtained from the book's Website. Consider fitting a linear model relating Y to all six X-variables. (a) What least squares assumptions (if any) seem to be violated? (b) Compute ri, Ci, DFITS;, and H. (c) Construct the index plots of ri,C, DFITS, and H; as well as the Potential- Residual plot. (d) Identify all unusual observations in the data and classify each according to type (i.e., outliers, leverage points, etc.). Table 4.8 | X, Data for Exercises 4.124.14 X3 X4 Row X, 16 443 29 676 Xo 205 129 339 1 115 536 247 202 481 296 43 617 514 400 473 157 440 480 316 S30 232 14 lll 256 6l0 266 611 10 600 480 279 446 4S0 335 459 276 266 196 110 188 205 100 I70 } 193 630 60 108 483 617 605 125 388 351 366 493 233 265 283 176 143 162 207 340 200 152 23 268 48 112 449 340 61 292 29 688 105 408 197 2s 40 46/ 88 Source: Chatterjee and Hadi (1988)Step by Step Solution
There are 3 Steps involved in it
Step: 1

Get Instant Access to Expert-Tailored Solutions
See step-by-step solutions with expert insights and AI powered tools for academic success
Step: 2

Step: 3

Ace Your Homework with AI
Get the answers you need in no time with our AI-driven, step-by-step assistance
Get Started


