

Question
(Y_1 ) is the Company-Z monthly revenue along the period Pre-COVID-19 (January 2018 to December 2019); (Y_2 ) is the same Company-Z monthly revenue but
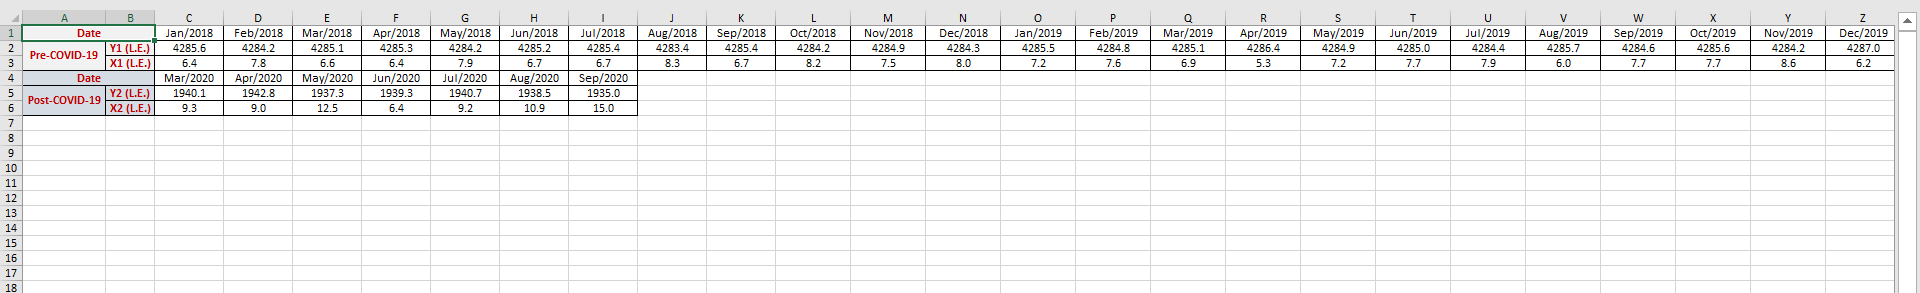
(Y_1 ) is the Company-Z monthly revenue along the period Pre-COVID-19 (January 2018 to December 2019); (Y_2 ) is the same Company-Z monthly revenue but during the period Post-COVID-19 (March 2020 to September 2020); (X_1 ) is the monthly operations cost during the period Pre-COVID-19 (January 2018 to December 2019); while (X_2 ) is the same monthly operations cost but during the period Post-COVID-19 (March 2020 to September 2020). Accordingly, in your analysis, you will depend on two main random variables over two time series. The first random variable is the Company-Z monthly revenue (Y), and the second random variable is the Company-Z monthly operations cost (X). The two random variables were chosen over two periods of time: the first is (Pre-COVID-19: January 2018 to December 2019), and the second is (Post-COVID-19: March 2020 to September 2020).
a.What are the appropriate measures of central tendency and measures of desperations that could be used to describe the Company-Z monthly revenue in Pre- and Post- COVID-19 ? Moreover, use the appropriate graphical technique to separately visualize both random variables?
a.What is the appropriate technique to test the following two hypotheses arguing: that the population mean of the monthly operations cost is 0.9 times the value of the average monthly operations cost during the period Pre-COVID-19 , and the population mean of the monthly operations cost is 1.3 times the value of the average monthly operations cost during the period Post-COVID-19 . Write the full analytical steps to find the appropriate decision for both hypotheses, as well as comment on the results?
b.What is the optimal technique to analyse the association relationship between the monthly revenue Pre-COVID-19 and the monthly operations cost Pre-COVID-19 ? Write the full analytical steps as well as comment on the results?
c.What are the 99 percent confidence intervals for the average monthly operations cost Pre- and Post- COVID-19 ? And what do you conclude by comparing these intervals? Moreover, what is the used methodology of constructing the confidence interval for each random variable, and why did you use the proposed methodology for each random variable?
d.What is the appropriate technique to assess: to what extent the variations in the monthly revenue Pre-COVID-19 could be interpreted by the monthly operations cost Pre-COVID-19 ? What does the proposed technique call the two random variables? Write the full analytical steps as well as comment on the results?
For all problem use the confidence level 99 percent.
Step by Step Solution
There are 3 Steps involved in it
Step: 1

Get Instant Access to Expert-Tailored Solutions
See step-by-step solutions with expert insights and AI powered tools for academic success
Step: 2

Step: 3
Ace Your Homework with AI
Get the answers you need in no time with our AI-driven, step-by-step assistance
Get Started
Big Ideas MATH Algebra 2
Authors: Ron Larson, Laurie Boswell
Common Core Curriculum
160840840X, 978-1608408405