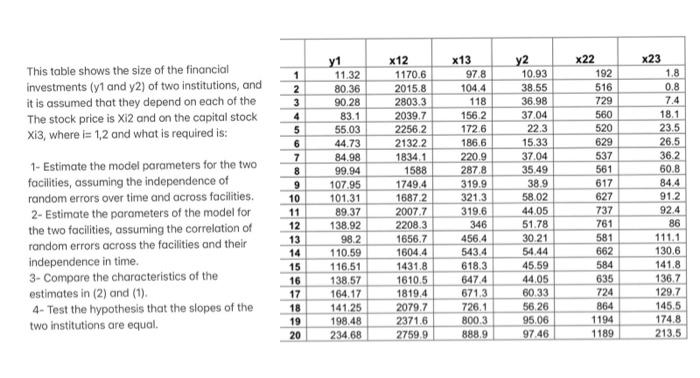
y1 This table shows the size of the financial investments (y1 and y2) of two institutions, and it is assumed that they depend on each of the The stock price is X12 and on the capital stock Xi3, where i= 1,2 and what is required is: 1- Estimate the model parameters for the two facilities, assuming the independence of random errors over time and across facilities. 2- Estimate the parameters of the model for the two facilities, assuming the correlation of random errors across the facilities and their independence in time, 3- Compare the characteristics of the estimates in (2) and (1) 4-Test the hypothesis that the slopes of the two institutions are equal. 1 2 3 4 5 6 7 8 9 10 11 12 13 14 15 16 17 18 19 20 11.32 80.36 90.28 83.1 55.03 44.73 84.98 99.94 107.95 101.31 89.37 138.92 982 110.59 116,51 138.57 164.17 141.25 198.48 234.68 x12 1170.6 2015.8 2803.3 2039.7 2256.2 2132.2 1834.1 1588 1749.4 16872 2007.7 2208.3 1656.7 1604.4 1431.8 1610.5 1819.4 2079.7 2371.6 2759.9 x13 978 104.4 118 156.2 172.6 186,6 220.9 287.8 319.9 321.3 319.6 346 456.4 543.4 618.3 6474 671.3 726.1 800.3 888.9 y2 10.93 38.55 36.98 37.04 22.3 15.33 37.04 35.49 38.9 58.02 44.05 51.78 30.21 54.44 45.59 44.05 60.33 56 26 95.06 97,46 x22 192 516 729 560 520 629 537 561 617 627 737 761 581 662 584 635 724 864 1194 1189 x23 1.8 0.8 7.4 18.1 23.5 26,5 36.2 60.8 84.4 91.2 92.4 86 111.1 130,6 141.8 136.7 129.7 145,5 174.8 213.5 y1 This table shows the size of the financial investments (y1 and y2) of two institutions, and it is assumed that they depend on each of the The stock price is X12 and on the capital stock Xi3, where i= 1,2 and what is required is: 1- Estimate the model parameters for the two facilities, assuming the independence of random errors over time and across facilities. 2- Estimate the parameters of the model for the two facilities, assuming the correlation of random errors across the facilities and their independence in time, 3- Compare the characteristics of the estimates in (2) and (1) 4-Test the hypothesis that the slopes of the two institutions are equal. 1 2 3 4 5 6 7 8 9 10 11 12 13 14 15 16 17 18 19 20 11.32 80.36 90.28 83.1 55.03 44.73 84.98 99.94 107.95 101.31 89.37 138.92 982 110.59 116,51 138.57 164.17 141.25 198.48 234.68 x12 1170.6 2015.8 2803.3 2039.7 2256.2 2132.2 1834.1 1588 1749.4 16872 2007.7 2208.3 1656.7 1604.4 1431.8 1610.5 1819.4 2079.7 2371.6 2759.9 x13 978 104.4 118 156.2 172.6 186,6 220.9 287.8 319.9 321.3 319.6 346 456.4 543.4 618.3 6474 671.3 726.1 800.3 888.9 y2 10.93 38.55 36.98 37.04 22.3 15.33 37.04 35.49 38.9 58.02 44.05 51.78 30.21 54.44 45.59 44.05 60.33 56 26 95.06 97,46 x22 192 516 729 560 520 629 537 561 617 627 737 761 581 662 584 635 724 864 1194 1189 x23 1.8 0.8 7.4 18.1 23.5 26,5 36.2 60.8 84.4 91.2 92.4 86 111.1 130,6 141.8 136.7 129.7 145,5 174.8 213.5


