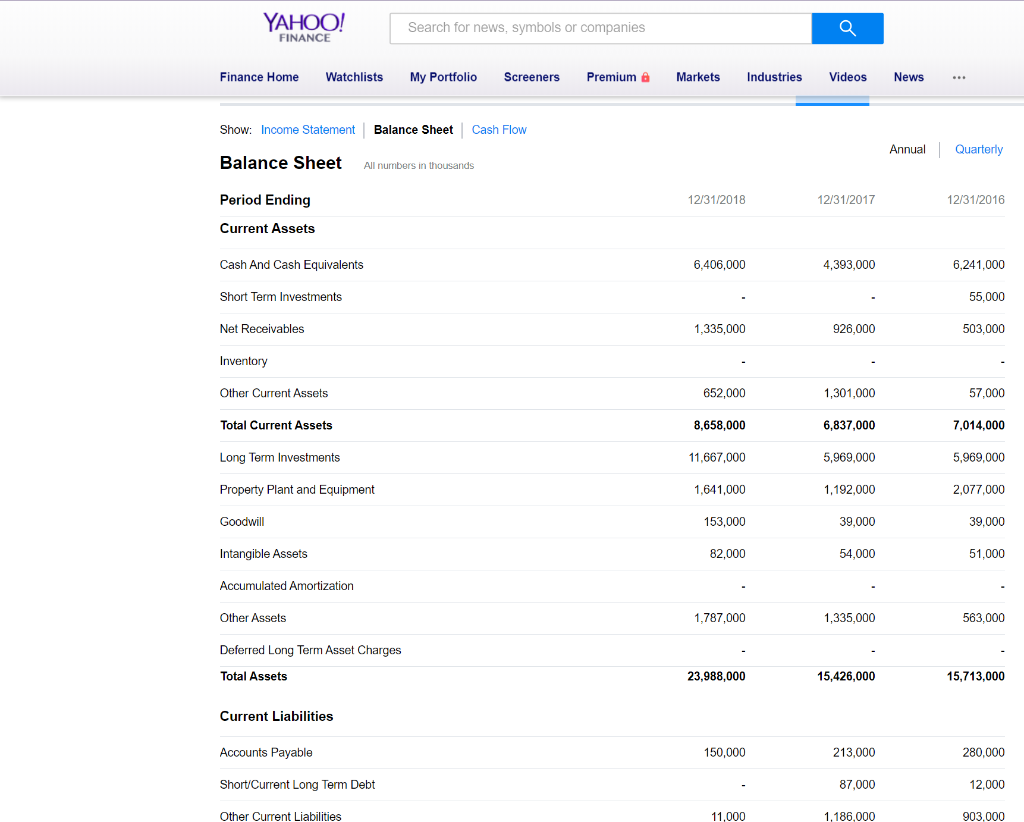
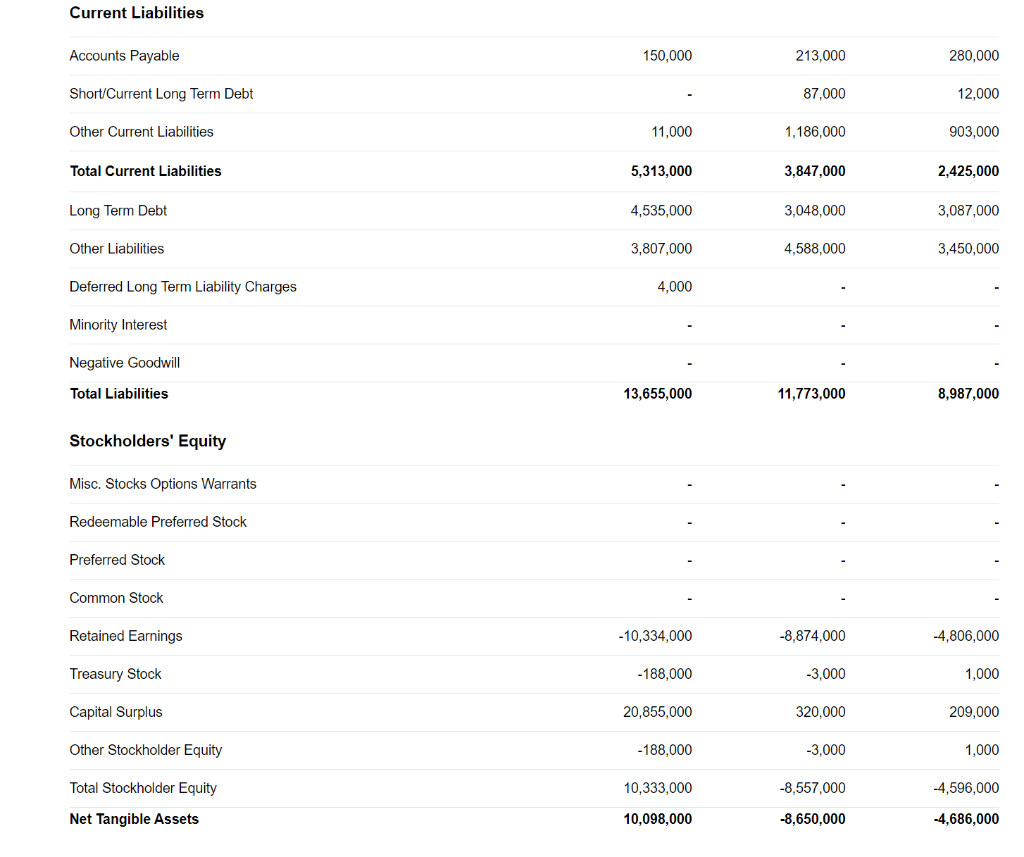
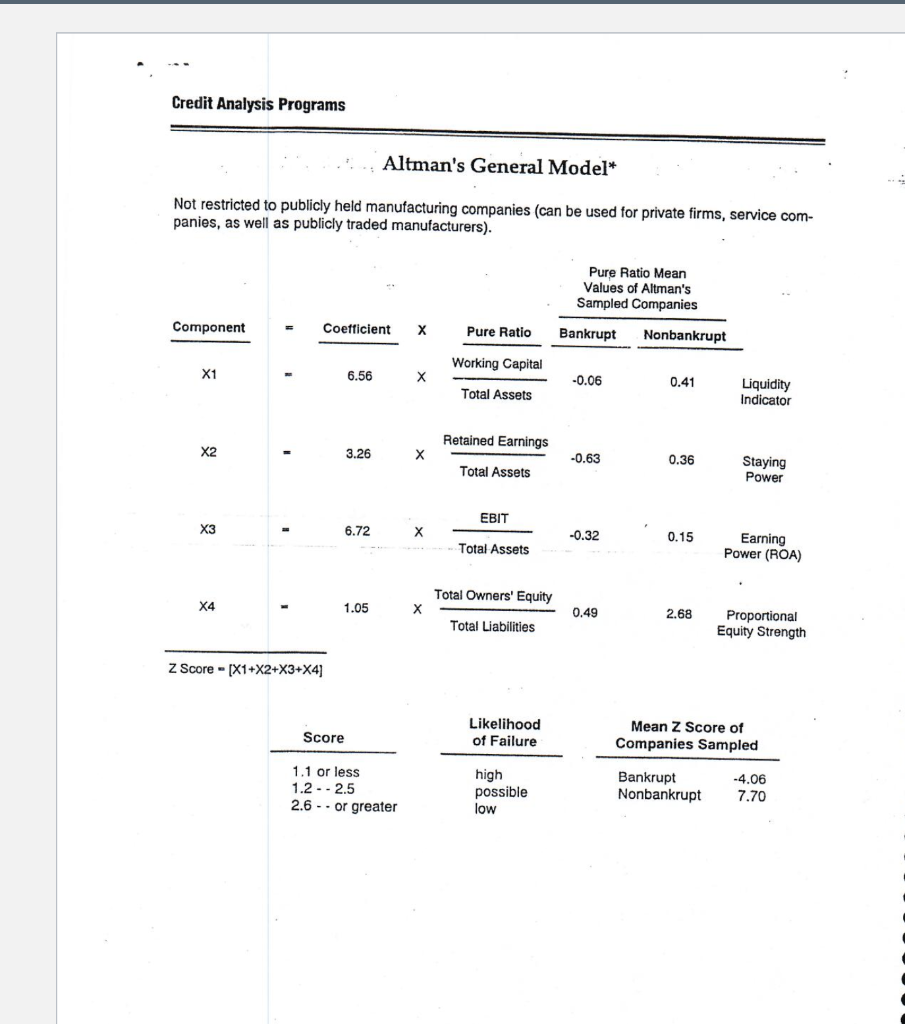
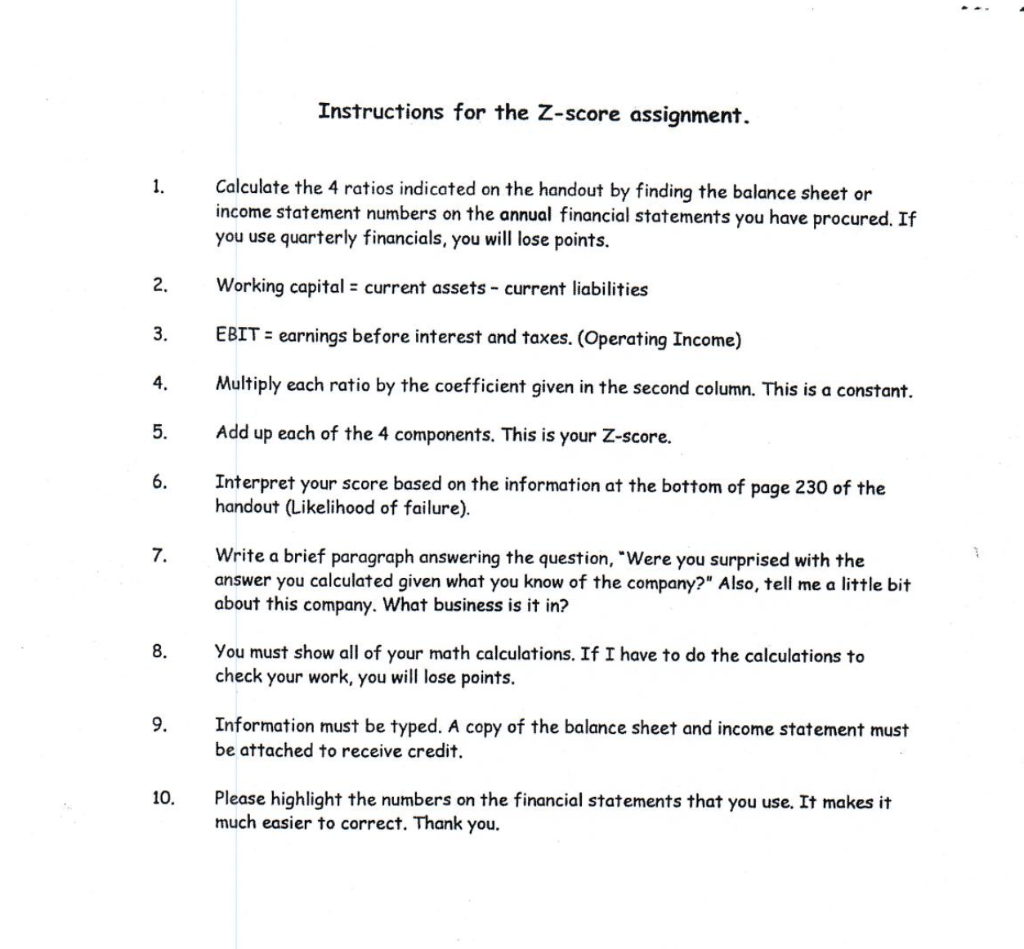
YAHOO! Search for news, symbols or companies FINANCE Finance Home Watchlists My Portfolio Screeners Premium a Markets Industries Videos News Balance Sheet Show: Income Statement Cash Flow Annual Quarterly Balance Sheet All numbers in thousands Period Ending 12/31/2018 12/31/2017 12/31/2016 Current Assets Cash And Cash Equivalents 6,406,000 4,393,000 6,241,000 Short Term Investments 55,000 1,335,000 926.000 Net Receivables 503,000 Inventory Other Current Assets 652,000 1,301,000 57,000 Total Current Assets 8,658,000 6,837,000 7,014,000 Long Term Investments 5,969,000 11,667,000 5,969,000 1,641.000 1,192,000 Property Plant and Equipment 2,077,000 Goodwill 153,000 39,000 39,000 82,000 54.000 Intangible Assets 51.000 Accumulated Amortization Other Assets 1.787,000 1,335,000 563.000 Deferred Long Term Asset Charges Total Assets 23,988,000 15,426,000 15,713,000 Current Liabilities Accounts Payable 150,000 213,000 280,000 Short/Current Long Term Debt 87,000 12.000 Other Current Liabilities 11,000 1.186.000 903.000 Current Liabilities 150,000 213,000 Accounts Payable 280,000 Short/Current Long Term Debt 12,000 87,000 11,000 903,000 Other Current Liabilities 1,186,000 Total Current Liabilities 5,313,000 3,847,000 2,425,000 Long Term Debt 4,535,000 3,048,000 3,087,000 Other Liabilities 3,807,000 4,588,000 3,450,000 Deferred Long Term Liability Charges 4,000 Minority Interest Negative Goodwill Total Liabilities 13,655,000 11,773,000 8,987,000 Stockholders' Equity Misc. Stocks Options Warrants Redeemable Preferred Stock Preferred Stock Common Stock Retained Earnings -10,334,000 -4,806,000 -8,874,000 Treasury Stock -188,000 -3,000 1,000 Capital Surplus 20,855,000 320,000 209,000 Other Stockholder Equity -3,000 1,000 -188,000 -4,596,000 Total Stockholder Equity 10,333,000 -8,557,000 Net Tangible Assets 10,098,000 -8,650,000 -4,686,000 Credit Analysis Programs Altman's General Model* Not restricted to publicly held manufacturing companies (can be used for private firms, service com- panies, as well as publicly traded manufacturers) Pure Ratio Mean Values of Altman's Sampled Companies Nonbankrupt Coefficient X Pure Ratio Bankrupt Component Working Capital X 0.41 Liquidity Indicator -0.06 6.56 X1 Total Assets Retained Earnings 0.36 Staying Power 3.26 X -0.63 X2 Total Assets EBIT 0.15 Earning Power (ROA) X -0.32 6.72 X3 Total Assets Total Owners' Equity Proportional Equity Strength 2.68 X 0.49 1.05 X4 Total Liabilities Z Score-[X1+X2+X3+X4] Likelihood of Failure Mean Z Score of Companies Sampled Score Bankrupt Nonbankrupt -4.06 7.70 high possible low 1.1 or less 1.2 2.5 2.6 -or greater Instructions for the Z-score assignment Calculate the 4 ratios indicated on the handout by finding the balance sheet or income statement numbers on the annual financial statements you have procured. If you use quarterly financials, you will lose points. 1 2. Working capital = current assets - current liabilities EBIT 3. earnings before interest and taxes. (Operating Income) Multiply each ratio by the coefficient given in the second column. This is a constant. 4. 5 Add up each of the 4 components. This is your Z-score. 6. Interpret your score based on the information at the bottom of page 230 of the handout (Likelihood of failure) 7 Write a brief paragraph answering the question, "Were you surprised with the answer you calculated given what you know of the company?" Also, tell me a little bit about this company. What business is it in? 8 You must show all of your math calculations. If I have to do the calculations to check your work, you will lose points 9. Information must be typed. A copy of the balance sheet and income statement must be attached to receive credit. Please highlight the numbers on the financial statements that you use. It makes it much easier to correct. Thank you. 10. YAHOO! Search for news, symbols or companies FINANCE Finance Home Watchlists My Portfolio Screeners Premium a Markets Industries Videos News Balance Sheet Show: Income Statement Cash Flow Annual Quarterly Balance Sheet All numbers in thousands Period Ending 12/31/2018 12/31/2017 12/31/2016 Current Assets Cash And Cash Equivalents 6,406,000 4,393,000 6,241,000 Short Term Investments 55,000 1,335,000 926.000 Net Receivables 503,000 Inventory Other Current Assets 652,000 1,301,000 57,000 Total Current Assets 8,658,000 6,837,000 7,014,000 Long Term Investments 5,969,000 11,667,000 5,969,000 1,641.000 1,192,000 Property Plant and Equipment 2,077,000 Goodwill 153,000 39,000 39,000 82,000 54.000 Intangible Assets 51.000 Accumulated Amortization Other Assets 1.787,000 1,335,000 563.000 Deferred Long Term Asset Charges Total Assets 23,988,000 15,426,000 15,713,000 Current Liabilities Accounts Payable 150,000 213,000 280,000 Short/Current Long Term Debt 87,000 12.000 Other Current Liabilities 11,000 1.186.000 903.000 Current Liabilities 150,000 213,000 Accounts Payable 280,000 Short/Current Long Term Debt 12,000 87,000 11,000 903,000 Other Current Liabilities 1,186,000 Total Current Liabilities 5,313,000 3,847,000 2,425,000 Long Term Debt 4,535,000 3,048,000 3,087,000 Other Liabilities 3,807,000 4,588,000 3,450,000 Deferred Long Term Liability Charges 4,000 Minority Interest Negative Goodwill Total Liabilities 13,655,000 11,773,000 8,987,000 Stockholders' Equity Misc. Stocks Options Warrants Redeemable Preferred Stock Preferred Stock Common Stock Retained Earnings -10,334,000 -4,806,000 -8,874,000 Treasury Stock -188,000 -3,000 1,000 Capital Surplus 20,855,000 320,000 209,000 Other Stockholder Equity -3,000 1,000 -188,000 -4,596,000 Total Stockholder Equity 10,333,000 -8,557,000 Net Tangible Assets 10,098,000 -8,650,000 -4,686,000 Credit Analysis Programs Altman's General Model* Not restricted to publicly held manufacturing companies (can be used for private firms, service com- panies, as well as publicly traded manufacturers) Pure Ratio Mean Values of Altman's Sampled Companies Nonbankrupt Coefficient X Pure Ratio Bankrupt Component Working Capital X 0.41 Liquidity Indicator -0.06 6.56 X1 Total Assets Retained Earnings 0.36 Staying Power 3.26 X -0.63 X2 Total Assets EBIT 0.15 Earning Power (ROA) X -0.32 6.72 X3 Total Assets Total Owners' Equity Proportional Equity Strength 2.68 X 0.49 1.05 X4 Total Liabilities Z Score-[X1+X2+X3+X4] Likelihood of Failure Mean Z Score of Companies Sampled Score Bankrupt Nonbankrupt -4.06 7.70 high possible low 1.1 or less 1.2 2.5 2.6 -or greater Instructions for the Z-score assignment Calculate the 4 ratios indicated on the handout by finding the balance sheet or income statement numbers on the annual financial statements you have procured. If you use quarterly financials, you will lose points. 1 2. Working capital = current assets - current liabilities EBIT 3. earnings before interest and taxes. (Operating Income) Multiply each ratio by the coefficient given in the second column. This is a constant. 4. 5 Add up each of the 4 components. This is your Z-score. 6. Interpret your score based on the information at the bottom of page 230 of the handout (Likelihood of failure) 7 Write a brief paragraph answering the question, "Were you surprised with the answer you calculated given what you know of the company?" Also, tell me a little bit about this company. What business is it in? 8 You must show all of your math calculations. If I have to do the calculations to check your work, you will lose points 9. Information must be typed. A copy of the balance sheet and income statement must be attached to receive credit. Please highlight the numbers on the financial statements that you use. It makes it much easier to correct. Thank you. 10


