

Answered step by step
Verified Expert Solution
Question
1 Approved Answer
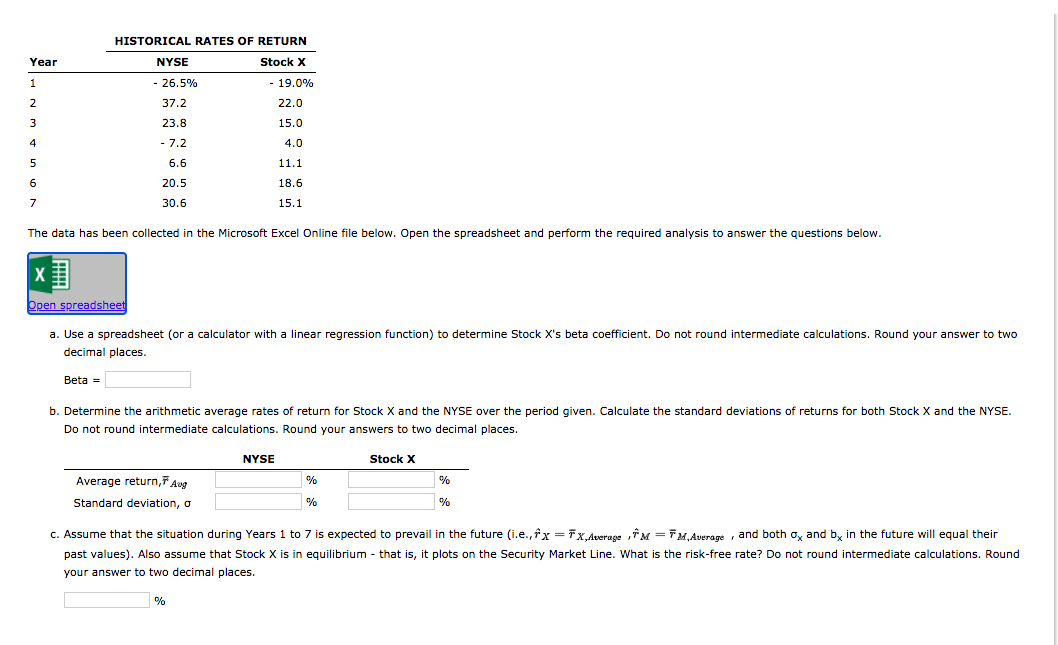
Year 1 2 3 HISTORICAL RATES OF RETURN NYSE Stock X - 26.5% - 19.0% 37.2 22.0 23.8 15.0 - 7.2 4.0 6.6 11.1 20.5
Step by Step Solution
There are 3 Steps involved in it
Step: 1

Get Instant Access to Expert-Tailored Solutions
See step-by-step solutions with expert insights and AI powered tools for academic success
Step: 2

Step: 3
Ace Your Homework with AI
Get the answers you need in no time with our AI-driven, step-by-step assistance
Get Started
Emotions In Finance Booms Busts And Uncertainty
Authors: Jocelyn Pixley
2nd Edition
1107633370, 978-1107633377