Answered step by step
Verified Expert Solution
Question
1 Approved Answer
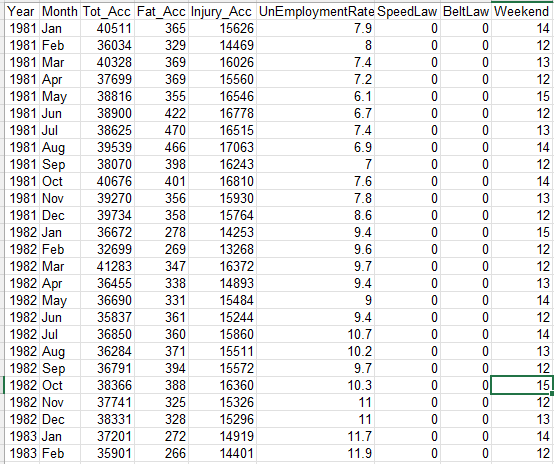
Year 1981 to 1989 Month Jan-Dec Tot_Acc statewide total accidents Fat_Acc statewide fatal accidents Injury_Acc statewide injury accidents UnEmploymentRate state unemployment rate SpeedLaw =1 after


| Year | 1981 to 1989 |
| Month | Jan-Dec |
| Tot_Acc | statewide total accidents |
| Fat_Acc | statewide fatal accidents |
| Injury_Acc | statewide injury accidents |
| UnEmploymentRate | state unemployment rate |
| SpeedLaw | =1 after 65 mph in effect |
| BeltLaw | =1 after seatbelt law |
| Weekend | # weekends in month |
PLEASE EXPLAIN USING R CODES AND INTERPRETATIONS
Use AccidentsTS.xlsx data which reports monthly accidents over the years 1981 , January 1989, December. a) Use the best forecasting method applicable to predict the Fatal Accidents for the first three months of the year 1990. b) Do you think any of the other time series covariates provided (the unemployment rates, 65mph max speed restrictions and compulsory seatbelt use) can significantly explain fatal accidents? If so, use an appropriate regression method to identify and quantify the effects of these variables on road accident fatalitiesStep by Step Solution
There are 3 Steps involved in it
Step: 1

Get Instant Access to Expert-Tailored Solutions
See step-by-step solutions with expert insights and AI powered tools for academic success
Step: 2

Step: 3

Ace Your Homework with AI
Get the answers you need in no time with our AI-driven, step-by-step assistance
Get Started


