

Answered step by step
Verified Expert Solution
Question
1 Approved Answer
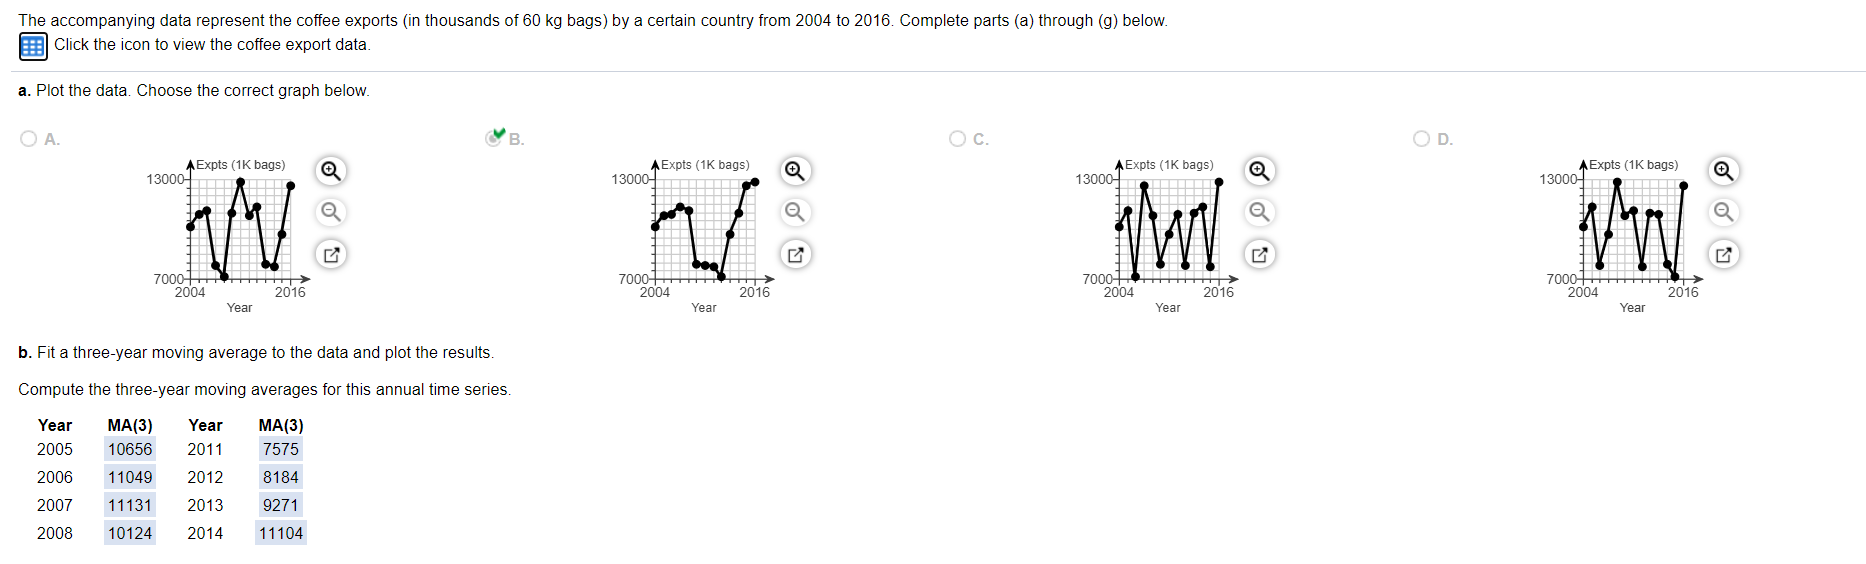
Year 2004 2005 2006 2007 2008 2009 2010 2011 2012 2013 2014 2015 2016 Exports (thousands 60 kg bag) 10178 10853 10936 11357 11101 7913
Year 2004 2005 2006 2007 2008 2009 2010 2011 2012 2013 2014 2015 2016
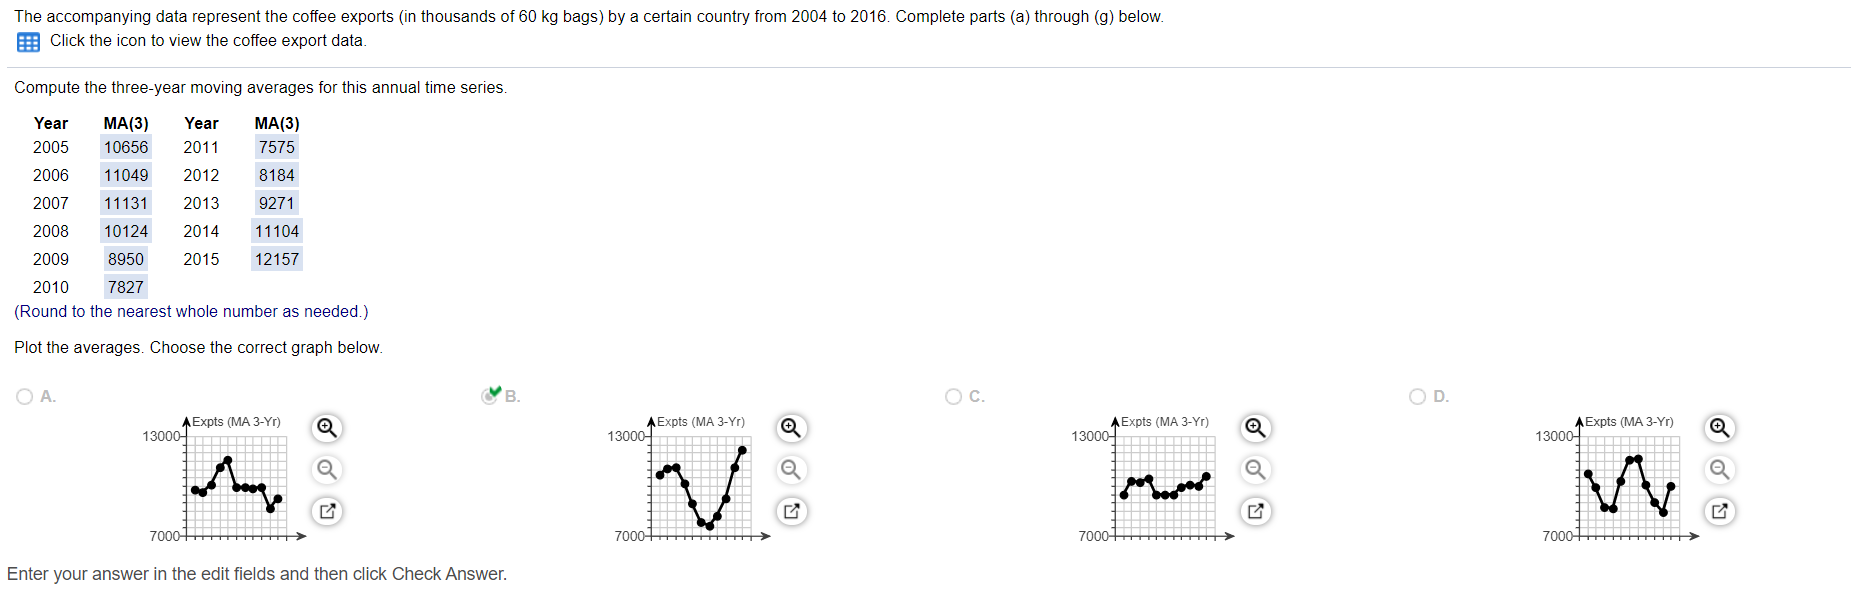
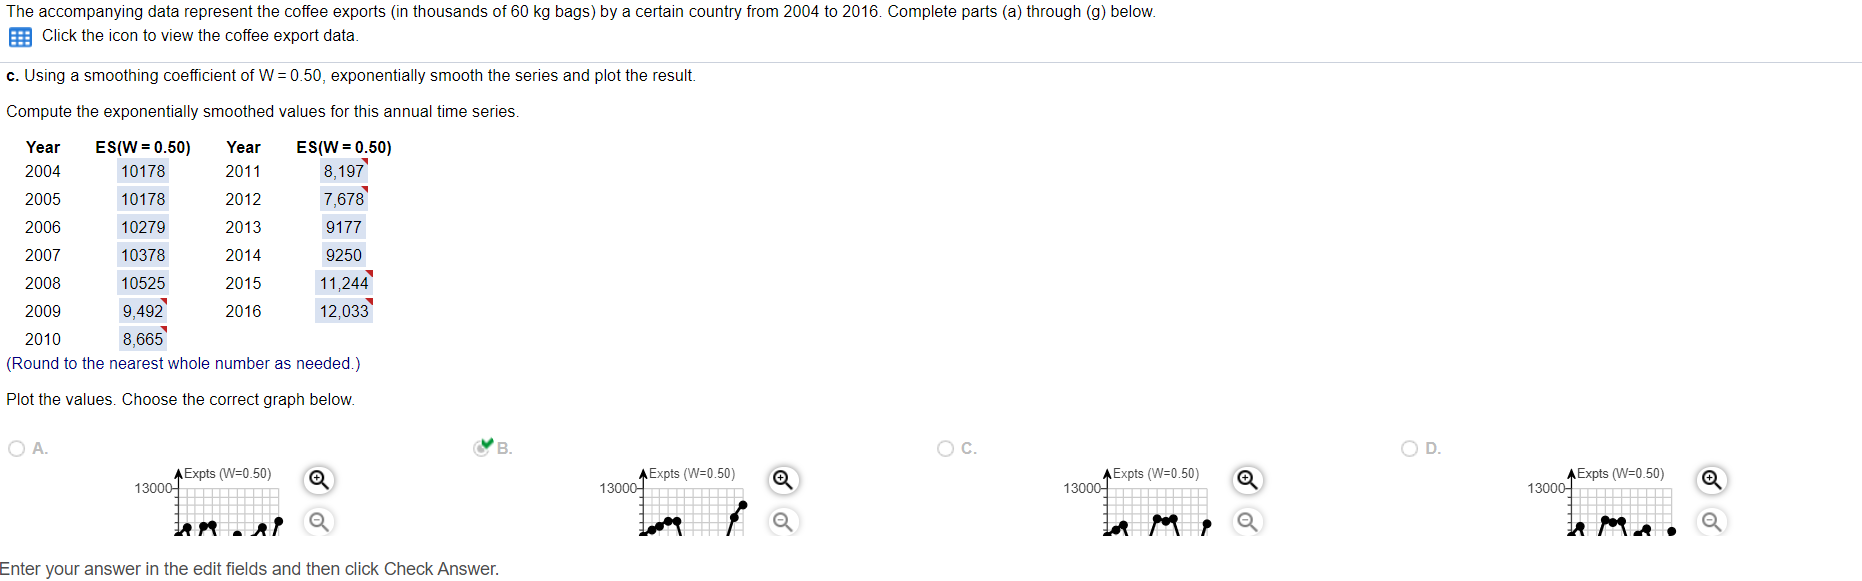
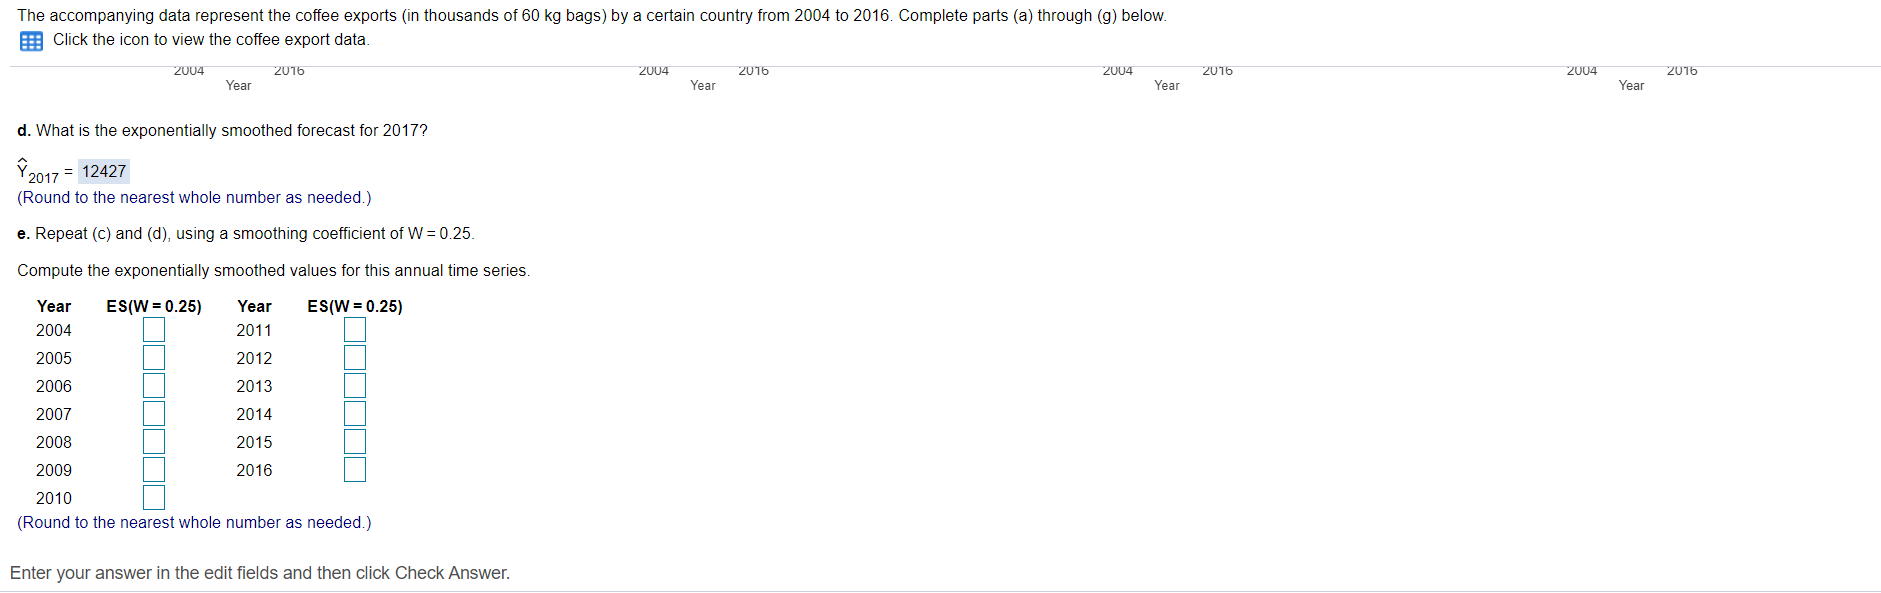
Exports (thousands 60 kg bag) 10178 10853 10936 11357 11101 7913 7837 7730 7159 9663 10992 12657 12821
Step by Step Solution
There are 3 Steps involved in it
Step: 1

Get Instant Access to Expert-Tailored Solutions
See step-by-step solutions with expert insights and AI powered tools for academic success
Step: 2

Step: 3
Ace Your Homework with AI
Get the answers you need in no time with our AI-driven, step-by-step assistance
Get Started
Theory And Applications Of Partial Functional Differential Equations
Authors: Abrar A Khan
1st Edition
9353141915, 9789353141912