

Answered step by step
Verified Expert Solution
Question
1 Approved Answer
Year 2007 2008 2009 2010 2011 2012 2013 2014 2015 2016 Dividend Income $1.00 $1.50 $1.40 $1.70 $1.90 $1.60 $1.70 $2.00 $2.10 $2.20 Stock X
Year 2007 2008 2009 2010 2011 2012 2013 2014 2015 2016 Dividend Income $1.00 $1.50 $1.40 $1.70 $1.90 $1.60 $1.70 $2.00 $2.10 $2.20 Stock X Share Price Beginning $20.00 $22.00 $21.00 $24.00 $22.00 $23.00 $26.00 $25.00 $24.00 $27.00 Ending $22.00 $21.00 $24.00 $22.00 $23.00 $26.00 $25.00 $24.00 $27.00 $30.00 Dividend Income $1.50 $1.60 $1.70 $1.80 $1.90 $2.00 $2.10 $2.20 $2.30 $2.40 Stock Y Share Price Beginning $20.00 $20.00 $20.00 $21.00 $21.00 $22.00 $23.00 $23.00 $24.00 $25.00 Ending $20.00 $20.00 $21.00 $21.00 $22.00 $23.00 $23.00 $24.00 $25.00 $25.00 Questions a. Determine the HPR for each stock in each of the preceding 10 years. Find the expected return for each stock, using the approach specified by Molly. b. Use the HPRs and expected return calculated in question a to find the standard deviation of the HPRs for each stock over the 10-year period. c. Use your findings to evaluate and discuss the return and risk associated with stocks X and Y. Which stock seems preferable? Explain. d. Ignoring her existing portfolio, what recommendations would you give Molly with regard to stocks X and Y? 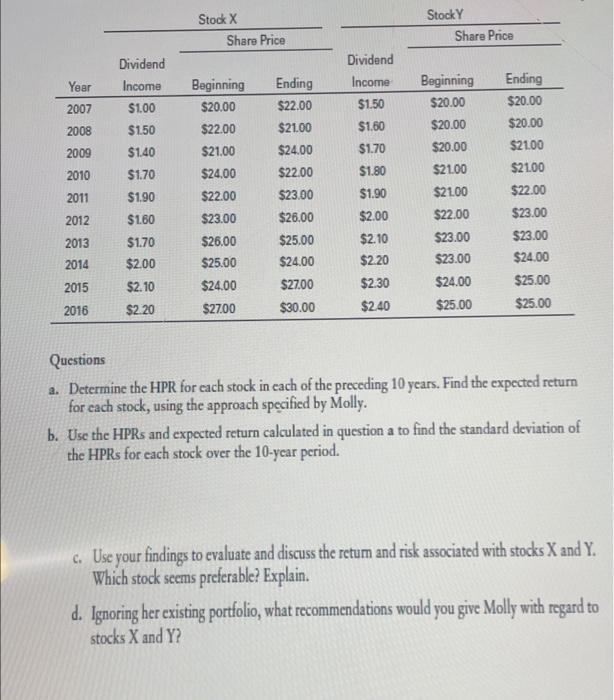 Questions a. Determine the HPR for each stock in each of the preceding 10 years. Find the expected return for each stock, using the approach specified by Molly. b. Use the HPRs and expected return calculated in question a to find the standard deviation of the HPRs for each stock over the 10-ycar period. c. Use your findings to evaluate and discuss the retum and risk associated with stocks X and Y. Which stock seems preferable? Explain. d. Ignoring her existing portfolio, what recommendations would you give Molly with regard to stocks X and Y
Year 2007 2008 2009 2010 2011 2012 2013 2014 2015 2016 Dividend Income $1.00 $1.50 $1.40 $1.70 $1.90 $1.60 $1.70 $2.00 $2.10 $2.20 Stock X Share Price Beginning $20.00 $22.00 $21.00 $24.00 $22.00 $23.00 $26.00 $25.00 $24.00 $27.00 Ending $22.00 $21.00 $24.00 $22.00 $23.00 $26.00 $25.00 $24.00 $27.00 $30.00 Dividend Income $1.50 $1.60 $1.70 $1.80 $1.90 $2.00 $2.10 $2.20 $2.30 $2.40 Stock Y Share Price Beginning $20.00 $20.00 $20.00 $21.00 $21.00 $22.00 $23.00 $23.00 $24.00 $25.00 Ending $20.00 $20.00 $21.00 $21.00 $22.00 $23.00 $23.00 $24.00 $25.00 $25.00 Questions a. Determine the HPR for each stock in each of the preceding 10 years. Find the expected return for each stock, using the approach specified by Molly. b. Use the HPRs and expected return calculated in question a to find the standard deviation of the HPRs for each stock over the 10-year period. c. Use your findings to evaluate and discuss the return and risk associated with stocks X and Y. Which stock seems preferable? Explain. d. Ignoring her existing portfolio, what recommendations would you give Molly with regard to stocks X and Y?
Step by Step Solution
There are 3 Steps involved in it
Step: 1

Get Instant Access to Expert-Tailored Solutions
See step-by-step solutions with expert insights and AI powered tools for academic success
Step: 2

Step: 3
Ace Your Homework with AI
Get the answers you need in no time with our AI-driven, step-by-step assistance
Get Started
Personal Finance
Authors: E. Thomas Garman, Raymond E. Forgue, Jonathan Fox
14th Edition
0357901495, 9780357901496