Year Bonus ($000)
2000 102.5
2001 73.1
2002 63.3
2003 95.6
2004 115.8
2005 144.1
2006 192.2
2007 185.9
2008 98.3
2009 136.9
2010 144.4
2011 114.1
2012 143.9
2013 164.7
2014 161.9
2015 135.1
2016 143.8

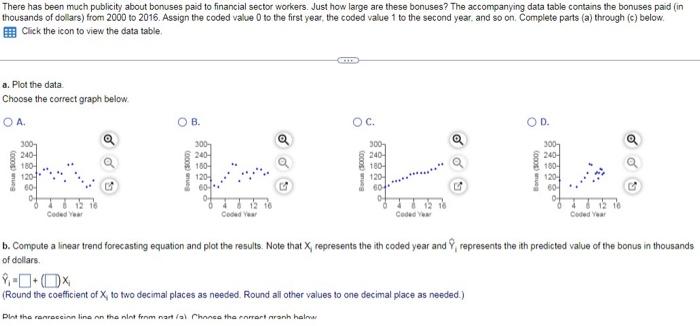
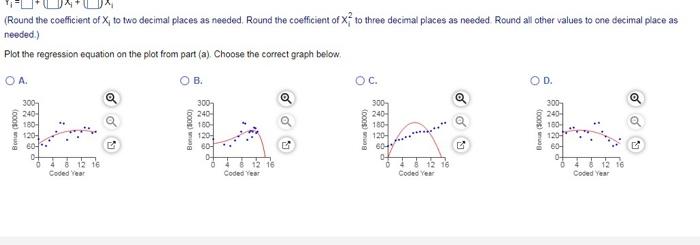
There has been much publicity about bonuses paid to financial sector workers. Just how large are these bonuses? The accompanying data table contains the bonuses paid (in thousands of dollars) from 2000 to 2016 . Assign the coded value 0 to the first year, the coded value 1 to the second year, and so on, Complete parts (a) through (c) below. Click the icon to view the data table a. Plot the data. Choose the correct graph below. A. B. C. D. b. Compute a linear trend forecasting equation and plot the results. Note that Xi represents the ith coded year and Y^1, represents the ith predicted value of the bonus in thousands of dollars. Y1=in+1Xi (Round the coefficient of X1 to two decimal places as needed. Round all other values to one decimal place as needed.) Plot the regression line on the plot from part (a). Choose the correct graph below. A. B. C. D. c. Compute a quadratic trend forecasting equation and plot the results. Note that Xi represents the th coded year and Y^i represents the ith predicted value of the bonus in thousands of dollars. Y^i=+1Xi+1Xi2 (Round the coefficient of X1 to two decimal places as needed. Round the coefficient of Xi2 to three decimal places as needed. Round all other values to coe decimal place as needed.) Plot the regression equation on the plot from part (a). Choose the correct graph below. A. B. C. D. There has been much publicity about bonuses paid to financial sector workers. Just how large are these bonuses? The accompanying data table contains the bonuses paid (in thousands of dollars) from 2000 to 2016 . Assign the coded value 0 to the first year, the coded value 1 to the second year, and so on, Complete parts (a) through (c) below. Click the icon to view the data table a. Plot the data. Choose the correct graph below. A. B. C. D. b. Compute a linear trend forecasting equation and plot the results. Note that Xi represents the ith coded year and Y^1, represents the ith predicted value of the bonus in thousands of dollars. Y1=in+1Xi (Round the coefficient of X1 to two decimal places as needed. Round all other values to one decimal place as needed.) Plot the regression line on the plot from part (a). Choose the correct graph below. A. B. C. D. c. Compute a quadratic trend forecasting equation and plot the results. Note that Xi represents the th coded year and Y^i represents the ith predicted value of the bonus in thousands of dollars. Y^i=+1Xi+1Xi2 (Round the coefficient of X1 to two decimal places as needed. Round the coefficient of Xi2 to three decimal places as needed. Round all other values to coe decimal place as needed.) Plot the regression equation on the plot from part (a). Choose the correct graph below. A. B. C. D


