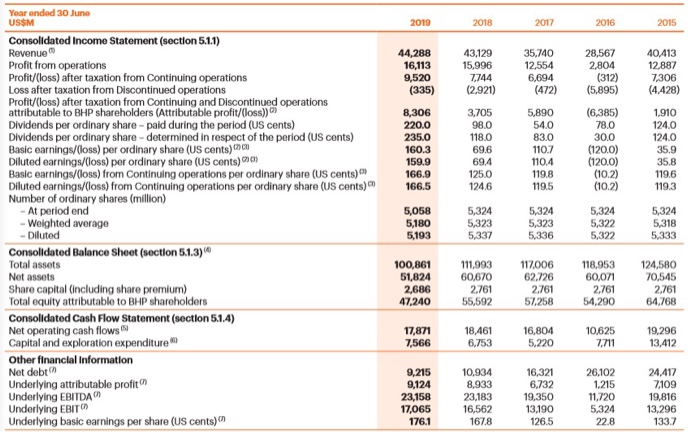
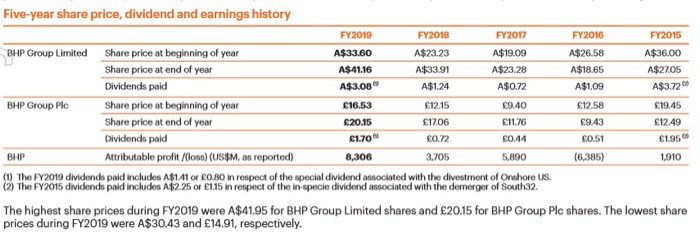
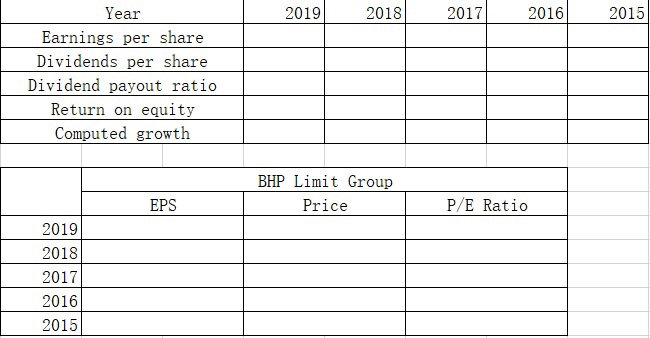
Year ended 30 June USSM 2019 2018 2017 2016 2015 44,288 16,113 9,520 43,129 15.996 7,744 (2.921) 35,740 12,554 6,694 (472) 28,567 2,804 (312) (5,895) 40,413 12,887 7,306 (4.428) (335) 8,306 220.0 235.0 160.3 159.9 166.9 166.5 3.705 98.0 118.0 69.6 69.4 125.0 124.6 5,890 54.0 83.0 110.7 110.4 119.8 119.5 (6,385) 78.0 30.0 (120.0) (1200) (10.2) (10.2) 1,910 124.0 124.0 35.9 35.8 119.6 1193 Consolidated Income Statement (section 5.1.1) Revenue Profit from operations Profit/(loss) after taxation from Continuing operations Loss after taxation from Discontinued operations Profit/(loss) after taxation from Continuing and Discontinued operations attributable to BHP shareholders (Attributable profit/(loss)) Dividends per ordinary share-paid during the period (US cents) Dividends per ordinary share-determined in respect of the period (US cents) Basic earnings/(loss) per ordinary share (US cents) Diluted earnings/(loss) per ordinary share (US cents) Basic earnings/(loss) from Continuing operations per ordinary share (US cents) Diluted earnings/(loss) from Continuing operations per ordinary share (US cents) Number of ordinary shares (million) - At period end - Weighted average - Diluted Consolidated Balance Sheet (section 5.1.3) Total assets Net assets Share capital (including share premium) Total equity attributable to BHP shareholders Consolidated Cash Flow Statement(section 5.1.4) Net operating cash flows Capital and exploration expenditure other financial Information Net debt Underlying attributable profit Underlying EBITDA Underlying EBIT Underlying basic earnings per share (US cents) 5,058 5,180 5,193 5,324 5,323 5.337 5,324 5,323 5,336 5,324 5,322 5,322 5,324 5,318 5,333 100,861 51,824 2,686 47,240 111,993 60,670 2,761 55,592 117,006 62.726 2.761 57,258 118,953 60,071 2.761 54,290 124,580 70.545 2.761 64.768 17,871 7,566 18.461 6,753 16,804 5.220 10,625 7,711 19,296 13,412 9.215 9,124 23,158 17,065 176.1 10.934 8,933 23,183 16,562 167.8 16,321 6,732 19,350 13,190 126.5 26,102 1.215 11,720 5.324 22.8 24.417 7109 19,816 13,296 133.7 Five-year share price, dividend and earnings history FY2019 FY2018 FY2017 FY2016 FY2015 BHP Group Limited A$33.60 A$41.16 A$3.08 A$26.58 A$18.65 A$1.09 Share price at beginning of year Share price at end of year Dividends paid Share price at beginning of year Share price at end of year Dividends paid Attributable profit/(loss)(US$M, as reported) BHP Group Plc A$23.23 A$33.91 A$1.24 12.15 17.06 0.72 3,705 A$36.00 A$27.05 A$3.72 19.45 12.49 195 16.53 20.15 61.70 A$19.09 A$23.28 A$0.72 9.40 11.76 0.44 5,890 12.58 9.43 0.51 (6,385) BHP 8,306 1,910 (1) The FY2019 dividends paid includes A$1.41 or 0.80 in respect of the special dividend associated with the divestment of Onshore US. (2) The FY2015 dividends paid includes A$2.25 or 1.15 in respect of the in-specie dividend associated with the demerger of South32. The highest share prices during FY2019 were A$41.95 for BHP Group Limited shares and 20.15 for BHP Group Plc shares. The lowest share prices during FY2019 were A$30.43 and 14.91, respectively. 2019 2018 2017 2016 2015 Year Earnings per share Dividends per share Dividend payout ratio Return on equity Computed growth BHP Limit Group Price EPS P/E Ratio 2019 2018 2017 2016 2015 Year ended 30 June USSM 2019 2018 2017 2016 2015 44,288 16,113 9,520 43,129 15.996 7,744 (2.921) 35,740 12,554 6,694 (472) 28,567 2,804 (312) (5,895) 40,413 12,887 7,306 (4.428) (335) 8,306 220.0 235.0 160.3 159.9 166.9 166.5 3.705 98.0 118.0 69.6 69.4 125.0 124.6 5,890 54.0 83.0 110.7 110.4 119.8 119.5 (6,385) 78.0 30.0 (120.0) (1200) (10.2) (10.2) 1,910 124.0 124.0 35.9 35.8 119.6 1193 Consolidated Income Statement (section 5.1.1) Revenue Profit from operations Profit/(loss) after taxation from Continuing operations Loss after taxation from Discontinued operations Profit/(loss) after taxation from Continuing and Discontinued operations attributable to BHP shareholders (Attributable profit/(loss)) Dividends per ordinary share-paid during the period (US cents) Dividends per ordinary share-determined in respect of the period (US cents) Basic earnings/(loss) per ordinary share (US cents) Diluted earnings/(loss) per ordinary share (US cents) Basic earnings/(loss) from Continuing operations per ordinary share (US cents) Diluted earnings/(loss) from Continuing operations per ordinary share (US cents) Number of ordinary shares (million) - At period end - Weighted average - Diluted Consolidated Balance Sheet (section 5.1.3) Total assets Net assets Share capital (including share premium) Total equity attributable to BHP shareholders Consolidated Cash Flow Statement(section 5.1.4) Net operating cash flows Capital and exploration expenditure other financial Information Net debt Underlying attributable profit Underlying EBITDA Underlying EBIT Underlying basic earnings per share (US cents) 5,058 5,180 5,193 5,324 5,323 5.337 5,324 5,323 5,336 5,324 5,322 5,322 5,324 5,318 5,333 100,861 51,824 2,686 47,240 111,993 60,670 2,761 55,592 117,006 62.726 2.761 57,258 118,953 60,071 2.761 54,290 124,580 70.545 2.761 64.768 17,871 7,566 18.461 6,753 16,804 5.220 10,625 7,711 19,296 13,412 9.215 9,124 23,158 17,065 176.1 10.934 8,933 23,183 16,562 167.8 16,321 6,732 19,350 13,190 126.5 26,102 1.215 11,720 5.324 22.8 24.417 7109 19,816 13,296 133.7 Five-year share price, dividend and earnings history FY2019 FY2018 FY2017 FY2016 FY2015 BHP Group Limited A$33.60 A$41.16 A$3.08 A$26.58 A$18.65 A$1.09 Share price at beginning of year Share price at end of year Dividends paid Share price at beginning of year Share price at end of year Dividends paid Attributable profit/(loss)(US$M, as reported) BHP Group Plc A$23.23 A$33.91 A$1.24 12.15 17.06 0.72 3,705 A$36.00 A$27.05 A$3.72 19.45 12.49 195 16.53 20.15 61.70 A$19.09 A$23.28 A$0.72 9.40 11.76 0.44 5,890 12.58 9.43 0.51 (6,385) BHP 8,306 1,910 (1) The FY2019 dividends paid includes A$1.41 or 0.80 in respect of the special dividend associated with the divestment of Onshore US. (2) The FY2015 dividends paid includes A$2.25 or 1.15 in respect of the in-specie dividend associated with the demerger of South32. The highest share prices during FY2019 were A$41.95 for BHP Group Limited shares and 20.15 for BHP Group Plc shares. The lowest share prices during FY2019 were A$30.43 and 14.91, respectively. 2019 2018 2017 2016 2015 Year Earnings per share Dividends per share Dividend payout ratio Return on equity Computed growth BHP Limit Group Price EPS P/E Ratio 2019 2018 2017 2016 2015


